29
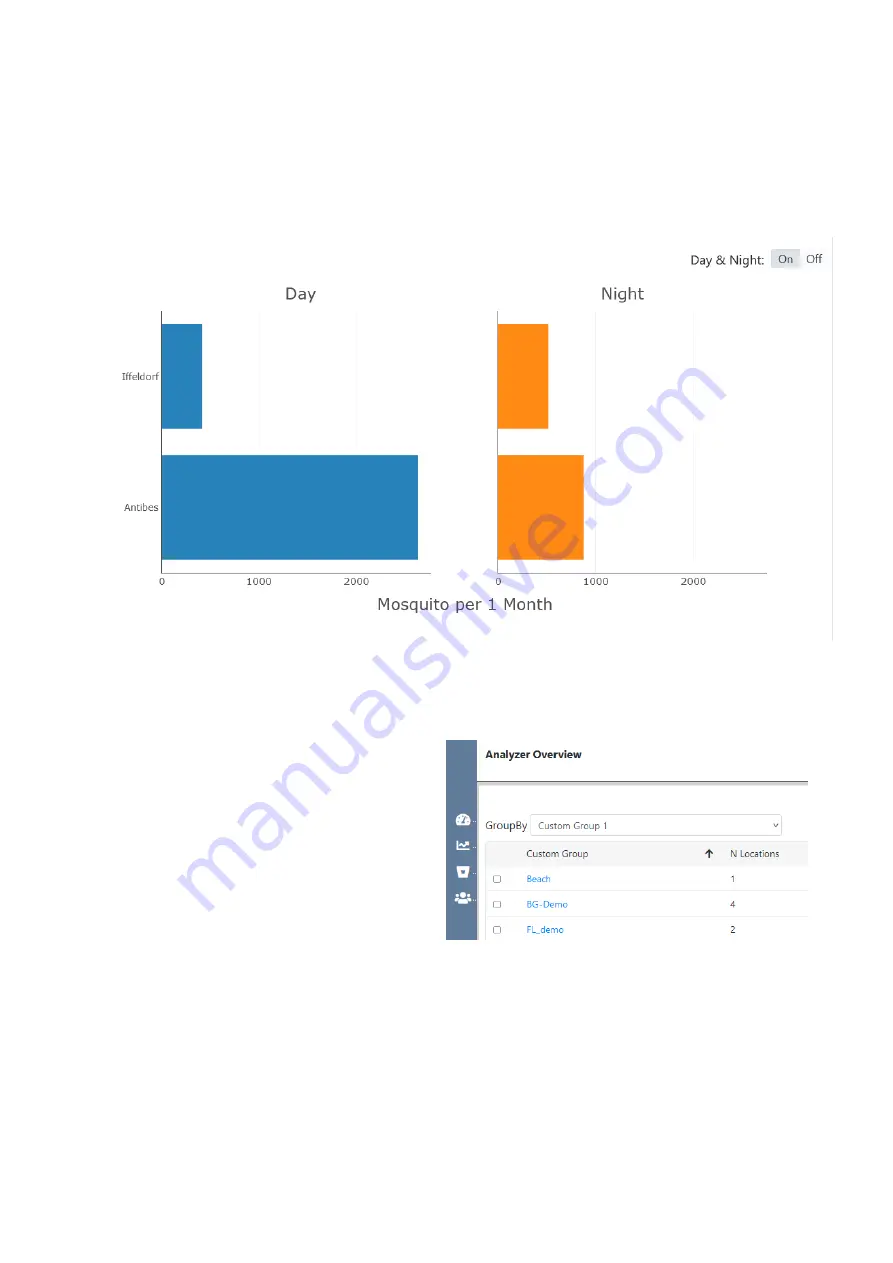
Horizontal Bar Chart
For multiple locations (or groups), you can also select the
same value for
Time Range
and
Frequency
in the Analyzer
settings (for example:
Time Range = This Month & Frequency
= 1 Month
). The result is a horizontal bar chart with the sum
of mosquitoes (or small or large objects) collected in the se-
lected time range, for each location.
The Day & Night option is also available for the horizontal
bar chart.
Single Group Analyzer
The Single Group Analyzer is like a shortcut of selecting mul-
tiple locations: For example, instead of manually selecting all
10 locations that belong to a certain group, you can simply
select that group:
Go to the “GroupBy” drop-down menu of the Analyzer Over-
view table and select the grouping factor. Then choose the
group that you want to analyze, by clicking on its name. For
example,
Custom Group 1 = BG-Demo
.
The four locations that were manually assigned to Custom
Group 1 = “BG-Demo” will then be analyzed.
By default, you’ll see a chart with the mean catch count of all
locations that belong to the selected group. Like for multip-
le locations, you can switch “Compare Locations” to “On”, to
see a line for each of the locations


