17
Dashboard
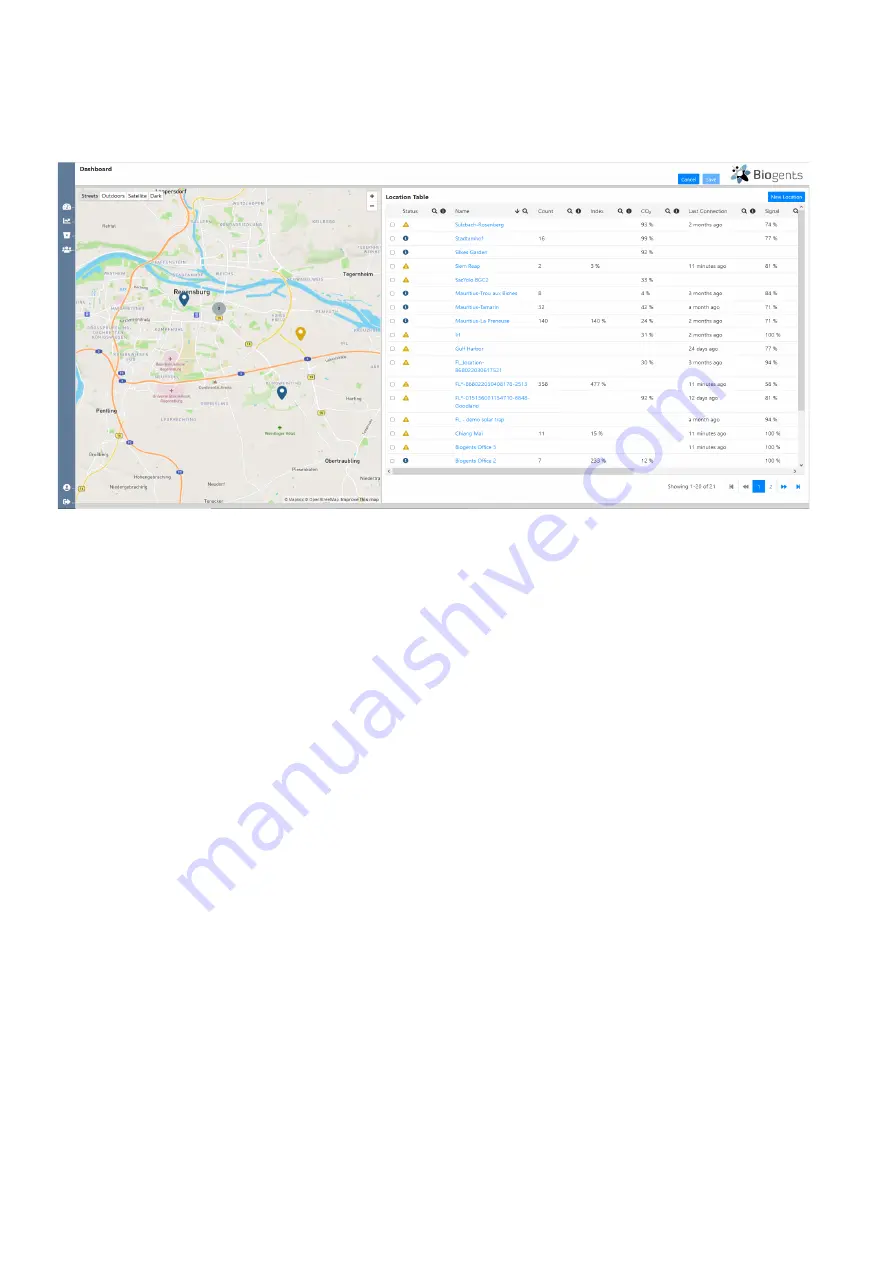
When you access the dashboard (figure below), you get an overview of all your locations in the form of a map and a table.
Every pin on the map refers to a trap location, and the color of the pin refers to a notification warning level.
Location Table
The Location Table gives an overview of your locations and
helps you to plan your operations, as it includes relevant in-
formation such as the catch count since last noon, warning
icons, info about signal strength, voltage range and similar.
You can sort the Location table by every column by clicking
on the arrow that appears, when you hover with the mouse
over the name of each column. This function is helpful if you
have many traps and want to easily identify for example tho-
se traps, that have warning notifications, or traps that had an
unusually high or low catch rate in the previous night.
The table includes the following columns:
•
Status:
Color-coded icons. When you hover over a yel-
low, blue, or red warning icon, the type of warning is dis-
played.
»
Green
: everything is functioning
»
Blue
: Info such as “No trap currently assigned”, “Trap
assigned but no transmission received”
»
Yellow
: Warning such as “No connection in the last
8 – 24 h”, “CO
2
supply at < 25%”
»
Red
: Error message such as “Refill CO
2
(very low or
empty)”, “Subscription expired, transmission disab-
led”, “Trap fan failure detected!”
You find more detailed information on the dashboard war
-
nings in the section “Troubleshooting” (p. 34).
•
Name:
Location name. Automatically or manually assig-
ned. Click on the name of a specific location to access the
Location Summary page.
•
Count
: Number of mosquitoes counted since last noon.
•
Index:
Number of counted mosquitoes in relation to set
Mosquito Catch Index Threshold.
The field remains emp
-
ty if you did not specify a threshold. The Mosquito Catch
Index Threshold is an integer number (> 0) that you can
specify for each trap. You can set a threshold on the set-
tings page that you reach by clicking the blue “View/Edit”
button next to the Location Info table (see p. 18).
•
CO
2
: Estimated CO
2
level of the cylinder. To get a good
estimate, make sure to always inform on the settings
page when you refill CO
2
. Also make sure to select the
correct cylinder size and the desired flow rate.
•
Last Connection
: The last time when data was transmit-
ted.
•
Signal
: Strength of the transmission signal.
•
Voltage Range
: Min and max supply voltage in the past
24 h. Fully charged battery: >12.8 V. Battery draining or
inadequate solar charging: < 11.5 V. The counter will be
turned off when the voltage drops to less than 11.2V
to protect the electronics. Once turned off, the counter
remains turned off until the voltage builds up again to
11.8 V.
•
Fan Status
: Either “On”, or “Fail”. Fail: currently turned on
but no current detected (fan is either defective or not po-
wered).
•
Fan Current
: Current that is drawn by the trap ventilator.
Normal range: BG-Pro: 250 mA +/- 20 %. BG-Sentinel:
400 mA +/- 20 %. < 50 mA: fan is either turned off, not
connected, or defective. Reading suddenly exceeding
normal range: fan blocked by twig or similar.


