


345
| Spectrum Monitor
Aruba Instant 6.5.0.0-4.3.0.0 | User Guide
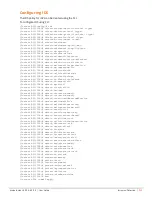
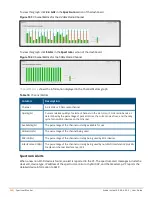
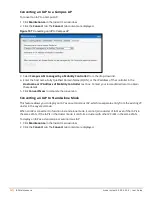
To view this graph, click
2.4 GHz
in the
Spectrum
section of the dashboard.
Figure 103
Channel Metrics for the 2.4 GHz Radio Channel
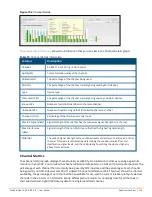
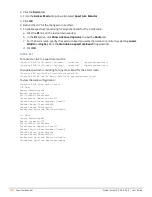
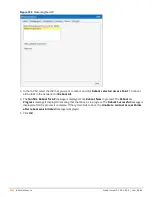
To view this graph, click
5 GHz
in the
Spectrum
section of the dashboard.
Figure 104
Channel Metrics for the 5 GHz Radio Channel
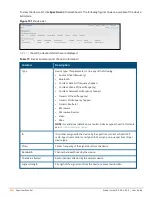
shows the information displayed in the Channel Metrics graph.
Column
Description
Channel
A 2.4 GHz or 5 GHz radio channel.
Quality(%)
Current relative quality of selected channels in the 2.4 GHz or 5 GHz radio bands, as
determined by the percentage of packet retries, the current noise floor, and the duty
cycle for non-Wi-Fi devices on that channel.
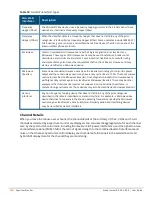
Availability(%)
The percentage of the channel currently available for use.
Utilization(%)
The percentage of the channel being used.
WiFi Util(%)
The percentage of the channel currently being used by Wi-Fi devices.
Interference Util(%)
The percentage of the channel currently being used by non-Wi-Fi interference plus Wi-
Fi adjacent channel interference (ACI)
Table 74:
Channel Metrics
Spectrum Alerts
When a new non-Wi-Fi device is found, an alert is reported to the VC. The spectrum alert messages include the
device ID, device type, IP address of the spectrum monitor or hybrid IAP, and the timestamp. VC reports the
detailed device information to AMP.


