User Guide
APconnections, Inc. // 303.997.1300 // www.netequalizer.com
Page 82 of 120
rev. 20170131
© 2014-2017 APconnections, Inc. All Rights Reserved
version 8.4
RTR Traffic History Reports
(
back
)
Traffic History Reports
enable you to quickly see how busy your network has been over a
period of time. Reports are available in seven time increments, showing data from 10
minutes to up to 4 weeks. You can view your entire network, or hone in on an individual IP,
Pool, or VLAN for analysis.
With Traffic History Reports, you can track NetEqualizer traffic (bandwidth usage), as well
as look at patterns of upload and download usage. You can view the top bandwidth users,
and see what penalties have been applied over time. You can also export data to review for
longer periods of time.
With this tool, you can get a better handle on how busy your network is over time, which is
useful in capacity planning, and also what IPs are consuming your bandwidth.
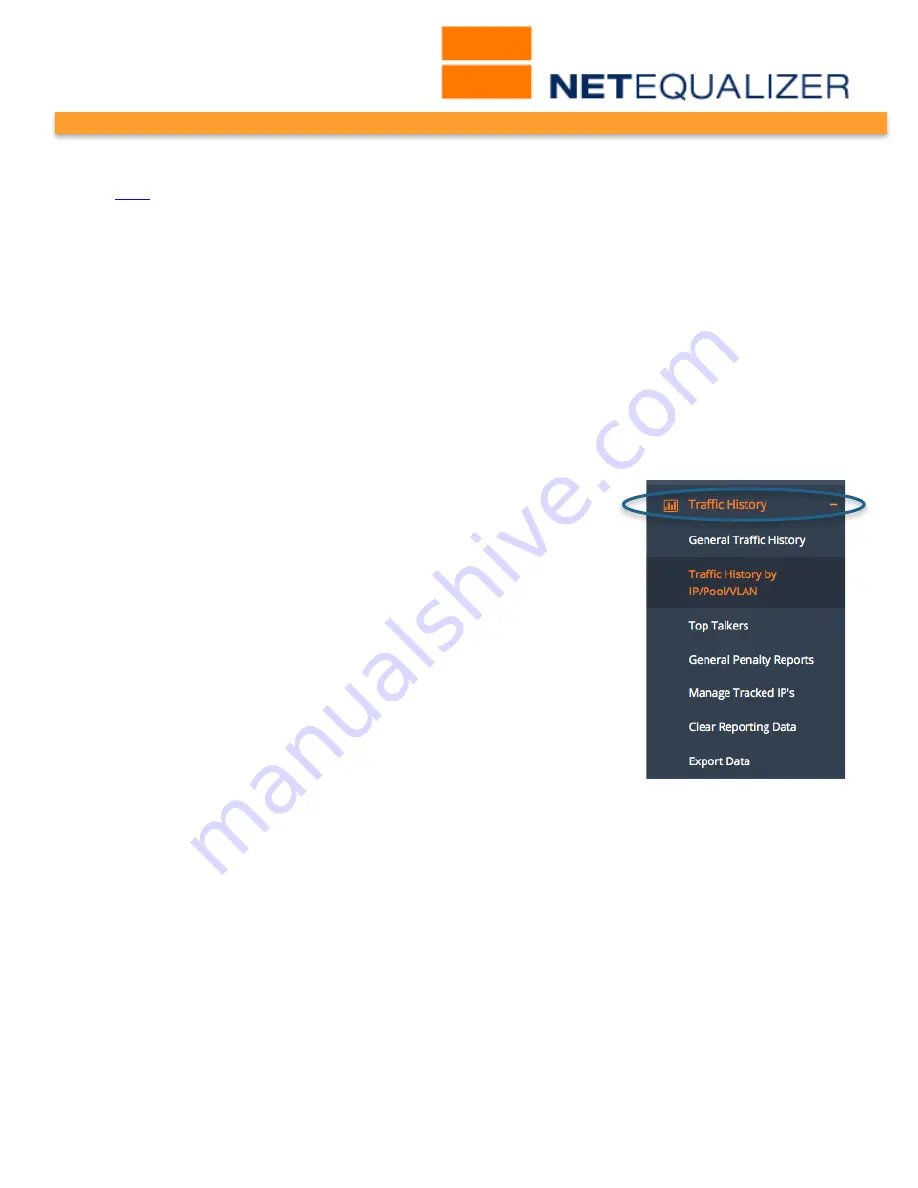
From the RTR Dashboard,
Click on -> Traffic History.
The screen at right opens. In the
Traffic History menu, there are currently five (5) reports and two
management capabilities.
In brief, General Traffic History enables you to see bandwidth usage
for your entire network. Traffic History by IP/Pool/VLAN shows
history for tracked IPs within selected entities. Top Talkers
highlights the biggest bandwidth users (by IP) on your network.
General Penalty Reports shows how equalizing has impacted your
network over time. Export Data enables you to save off reporting
data if you need to maintain > 4 weeks of data.
Manage Tracked IPs is used to set up which IPs or subnets will be
available for reporting. Clear Reporting Data will erase all historical
data.
We will review Traffic History reports and management capabilities in detail below.


