20
CHARTS MENU
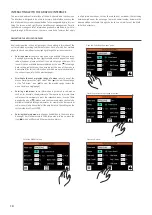
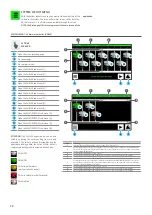
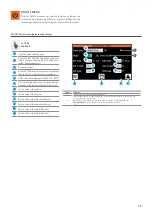
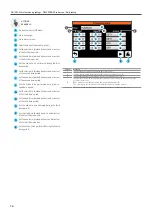
With the CHARTS menu you can view the real-time chart of the probes
connected to the pCOe expansion board (which must be connected on
the system flow and return);
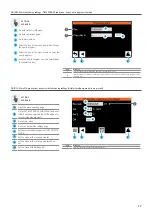
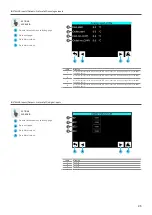
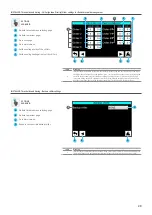
CHARTS - Displays real-time charts of the values read by the system side probes
A
B
C
Open the menu selecting page;
Allows transferring the temperature data in a
.CSV file on physical medium (connected to the
USB port on the back of the touch screen display);
Go to alarms menu;
Index
Meaning
1
Indicates today’s date
2
Indicates the current time
3
The Y axis indicates the temperature (°C)
4
The Y axis indicates the time to which to refer the temperature data read by the probes
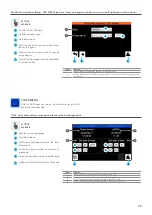
ACTIONS
AVAILABLE:
D
Allows you to scroll the chart back in time;
E
Allows you to scroll the chart forward over time;
F
Allows you to zoom out on the chart;
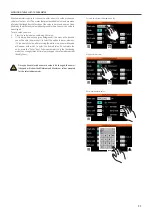
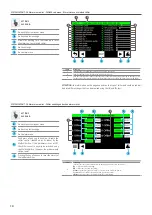
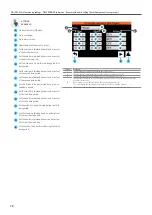
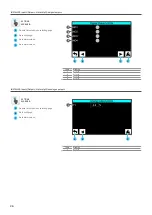
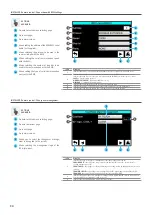
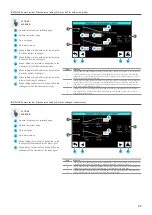
CHARTS - Display charts in real time regarding values read by the 2/4-pipe system recovery side probes (visible if multipurpose units are present)
A
B
C
Open the menu selecting page;
Go to the relative system side chart;
Go to alarms menu;
Index
Meaning
1
Indicates today’s date
2
Indicates the current time
3
The Y axis indicates the temperature (°C)
4
The Y axis indicates the time to which to refer the temperature data read by the probes
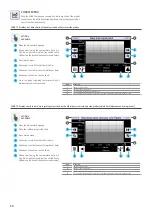
ACTIONS
AVAILABLE:
D
Allows you to scroll the chart back in time;
E
Allows you to scroll the chart forward over time;
F
Allows you to zoom out on the chart;
G
Allows transferring the temperature data in a
.CSV file on physical medium (connected to the
USB port on the back of the touch screen display);
1
A
C
2
3
4
B
D
F
E
G
G
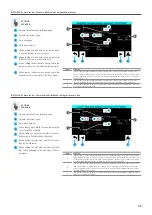
Go to the graph regarding the recovery side (if
multipurpose units are present);
G
1
A
C
2
3
4
B
D
F
E
G
G
Содержание Multichiller-Evo
Страница 2: ......


