


30
Gentier Real-Time PCR System
▶
User Management
tab: if user login as
admin
user account (the password is "admin"), user
can manage general user accounts in this tab.
< Add >
:
admin
user can add general user accounts in
User Management
tab.
< Delete >
:
admin
user can delete general user accounts in
User Management
tab.
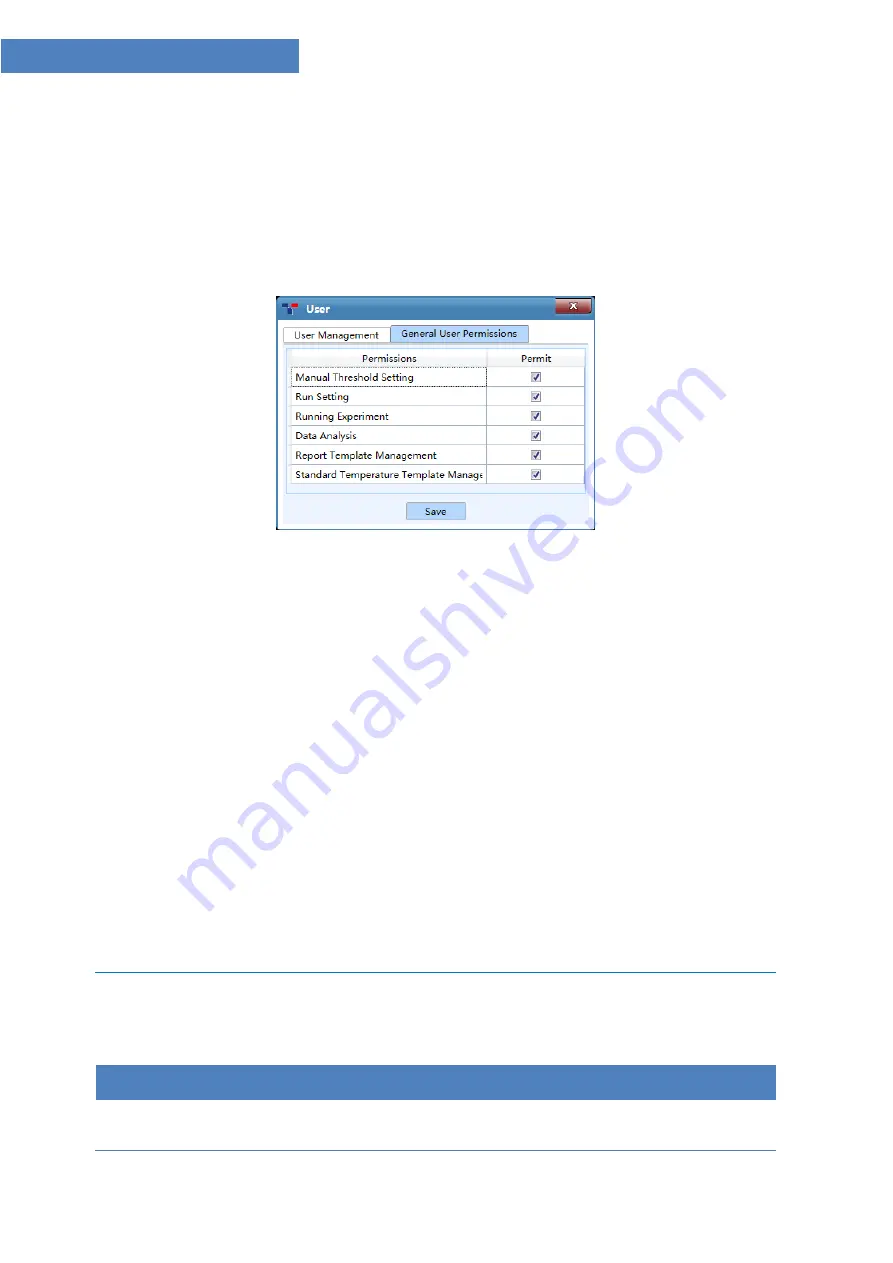
▶
General User Permissions
tab: as shown in figure D-3.6b.
Figure D-3.6b User interface - General User Permissions tab
a.
If user login as
admin
user account, user can manage general user permissions.
Admin
user can set the general user permissions by check relevant
Permissions
check box
in the
Permit
column.
Admin
user can click
< Save >
to save the current general user permission settings.
b.
If user login as general user account, user can view the general user permissions in this tab.
3.
Choose Language
: click
Choose Language
option in the
Option
submenu and the
application software provide two optional sofware languages:
Chinese
: check
Chinese
option and the software language will switch to Chinese after
restarting the application sofware.
English
: check
English
option and the software language will switch to English after
restarting the application sofware.
Help (H)
submenu: includes three options.
Options and Functional Description
1.
User Manual
: open the Gentier Real- Time PCR System User Manual.
Summary of Contents for Gentier 48E
Page 14: ......


