EcoView Web
Reports
58 | 62
Siemens Industry, Inc.
EcoView Energy Management System
125-3586
Building Technologies
2017-09-11
1
Select Site.
Displays all the sites for your account. Depending on graph type, you may be able to select
multiple sites.
To display specific sites in the list, type a full or partial site name in the Search box.
NOTE: A site is offline if its name displays in red. Historical data may be missing during offline
conditions.
2
Select Graph
Depending on the selected site(s), displays all available graph types.
3
Select Devices
Depending on the selected site(s) and graph(s), displays available devices.
4
Set Dates
Provides the ability to specify a preset or custom range. Click the Date Range drop-down list, or
specify the custom dates and intervals in the Date Range fields.
Depending on your selection in the Preset Date Range drop-down list or the Date Range fields,
the Display Interval automatically adjusts accordingly. While you may specify a different interval,
he graph may not provide meaningful information.
Reports
Reports are different from graphs in that they present the data in tabular, rather than
graphical format and can summarize the information across multiple sites instead of
just a single site or HVAC unit.
The Field Unit Energy Consumption report displays consumption for all selected sites.
Summary Values are:
●
Total kWh
●
Avg Daily kWh (If a time period longer than 24 hours is selected.)
●
Avg Weekly kWh (If a time period longer than seven days is selected.)
●
Avg Monthly kWh (If a time period longer than one month is selected.)
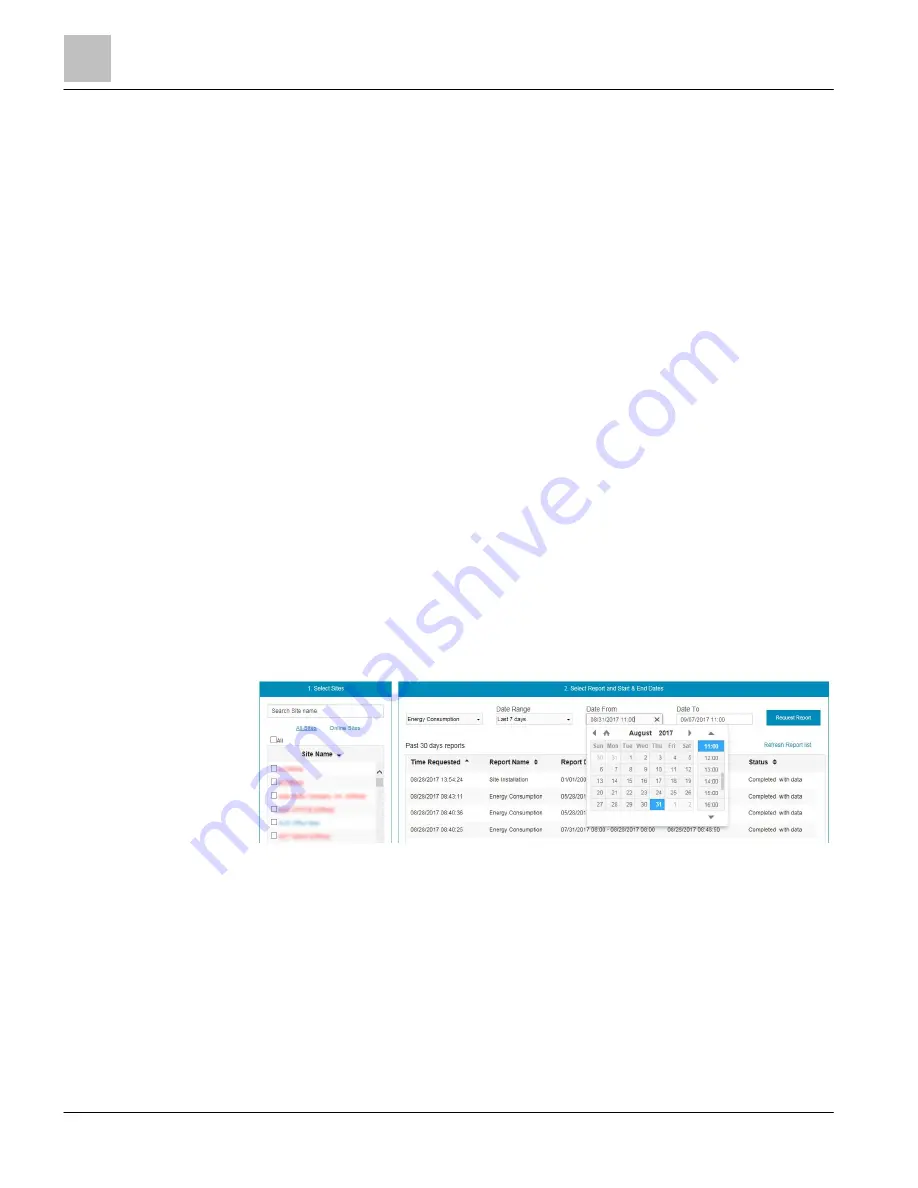
Figure 26: Selecting a Date Range for a Report.
Running a Report
1. Select the appropriate report from the drop-down box.
a
The Set Report Filter dialog box displays.
2. Quick select a timeframe from the Date Range dropdown list or select a custom
period using the Date From and Date To calendar selection tools.
3. Click the Request Report button.


