OPERATION
AUTOPILOT
NautoPilot 5000 Series
59
4002.DOC010102
Edition: September 2014
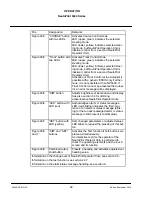
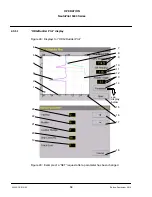
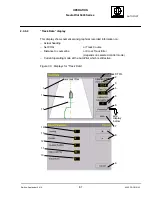
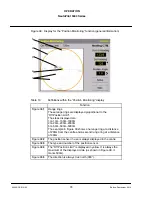
This display in Figure 28 shows numerical and graphical recorded information on:
-- Actual heading
-- Set heading or Set COG
or Track Course
(depends on selected control mode)
-- Rudder position angle
-- Current operating mode at the AutoPilot which is still active.
Table 6
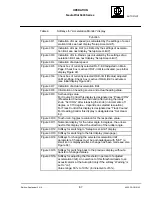
Softkeys for ”HDG/Rudder Plot” display
Function
Figure 28/1
Touch--icon, displays a legend for the recorded information.
Figure 28/2
Axis for recorded rudder angle [deg].
Figure 28/3
The rudder position angle is displayed as a magenta colored
graph.
Figure 28/4
Time axis for records [min].
Figure 28/5
Touch--icon, toggles resolution for the time axis 5 min / 20 min.
Figure 28/6
Axis for recorded current heading.
Figure 28/7
Touch--icon, toggles resolution for the heading axis
+/-- 20 deg / +/-- 60 deg.
Figure 28/8
The actual heading is displayed as a blue graph.
Figure 28/9
Information regarding heading source and actual heading
value.
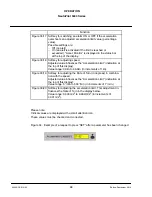
Figure 28/10 Set heading value.
For Course Control this display is designated as “Presel.COG”
(Preselected Course Over Ground) after turning the rotary
knob, “Set COG” after releasing the knob.
For Track Control this display is designated as “Track Course”.
For Heading Control this display is designated as “Set Head-
ing”.
Figure 28/11 Touch--icon, toggles resolution for the set heading value.
Figure 28/12 Set Heading is displayed by an orange dotted line.
Figure 28/13 Rudder angle value with an arrow indicating
the rudder direction.
Figure 28/14 Softkey, switches to the “Actual Parameter” display.
Figure 28/15 Softkey, switches to the main (initial) display.
Figure 28/16 Touch--icon, toggles resolution for the rudder angle axis
+/-- 8 deg / +/-- 16 deg.

