


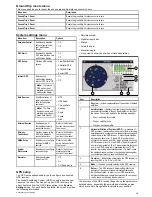


26.6 Data cell and databar
customization
You can customize the data displayed in on-screen cells with a
wide range of data.
Customizable data is displayed in the databar, extended databar
(HybridTouch displays only) or data cells areas of the screen.
The databar, extended databar and data cells are available in
all applications.
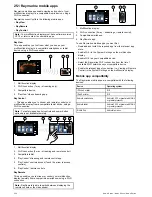
The 3 areas of the screen where customizable data is displayed
are illustrated and described below:
D
12296-2
2
3
1
1.
Databar
— permanently displayed at the top of the screen
in the chart, radar, fishfinder, and weather applications.
The databar contains data cells that can be customized to
display data from a wide range of categories.
2.
Expanded Databar
— (HybridTouch displays only)
displayed when you touch the databar. Additional data cells
can be displayed, from a wide range of data categories. The
expanded databar is displayed until the screen is touched
again. You can display the status icons below the expanded
databar. This provides status information for external
equipment:
3.
Data overlay cells
— up to 2 data cells can be displayed.
Each cell can display one item of data from the available
data categories. Data is displayed on-screen permanently.
Customizing data overlay cells
In the chart, radar, fishfinder, or weather application:
1. Select
Menu
.
2. Select
Presentation
.
3. Select
Data Overlay Set-up
.
4. To customize Data Cell 1, select
Data Cell 1 > ON
.
5. To customize Data Cell 2, select
Data Cell 2 > ON
.
6. Choose the
Select Data Cell 1
or
Select Data Cell 2
menu
item, as appropriate.
7. Select the category that reflects the type of data you want to
display in the cell. For example, Depth data.
8. Select the data item.
The data you selected is displayed on-screen in the
appropriate data overlay cell.
Customizing the databar
From the homescreen:
1. Select
Customize
.
2. Select
Databar Set-up
.
3. Select
Edit Databar
.
4. In the databar, select the cell that you want to change.
The Select Data Category menu will be displayed.
5. Select the category that reflects the type of data you want to
display in the cell. For example, Depth data.
6. Select the data item.
The data you selected is displayed on-screen in the
appropriate cell.
7. Select
Home
or
Back
when completed.
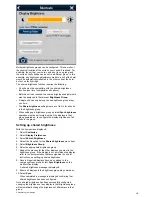
Displaying status icons in the databar
Touchscreen multifunction displays enable you to display status
icons in the databar.
From the homescreen:
1. Select
Customize
.
2. Select
Databar Set-up
.
3. Select
Status Icon Bar
so that On is highlighted.
The status icons are now displayed below the expanded
databar.
274
New a Series / New c Series / New e Series
Summary of Contents for a67
Page 2: ......
Page 4: ......
Page 8: ...8 New a Series New c Series New e Series...
Page 12: ...12 New a Series New c Series New e Series...
Page 20: ...20 New a Series New c Series New e Series...
Page 36: ...36 New a Series New c Series New e Series...
Page 70: ...70 New a Series New c Series New e Series...
Page 100: ...100 New a Series New c Series New e Series...
Page 110: ...110 New a Series New c Series New e Series...
Page 116: ...116 New a Series New c Series New e Series...
Page 158: ...158 New a Series New c Series New e Series...
Page 182: ...182 New a Series New c Series New e Series...
Page 204: ...204 New a Series New c Series New e Series...
Page 214: ...214 New a Series New c Series New e Series...
Page 236: ...236 New a Series New c Series New e Series...
Page 240: ...240 New a Series New c Series New e Series...
Page 260: ...260 New a Series New c Series New e Series...
Page 290: ...290 New a Series New c Series New e Series...
Page 306: ...306 New a Series New c Series New e Series...
Page 314: ...314 New a Series New c Series New e Series...
Page 329: ......
Page 330: ...www raymarine com...