26
Promega Corporation · 2800 Woods Hollow Road · Madison, WI 53711-5399 USA · Toll Free in USA 800-356-9526 · 608-274-4330 · Fax 608-277-2516
TM470 · 4/16
www.promega.com
3.D. Results Screen
When running a protocol, the results will display in real-time as the protocol proceeds. Results are automatically
saved within the GloMax
®
Navigator Software. However, they can also be exported to a variety of locations,
including the local Tablet PC, to a USB flash drive, a network drive, or to a cloud location.
1.
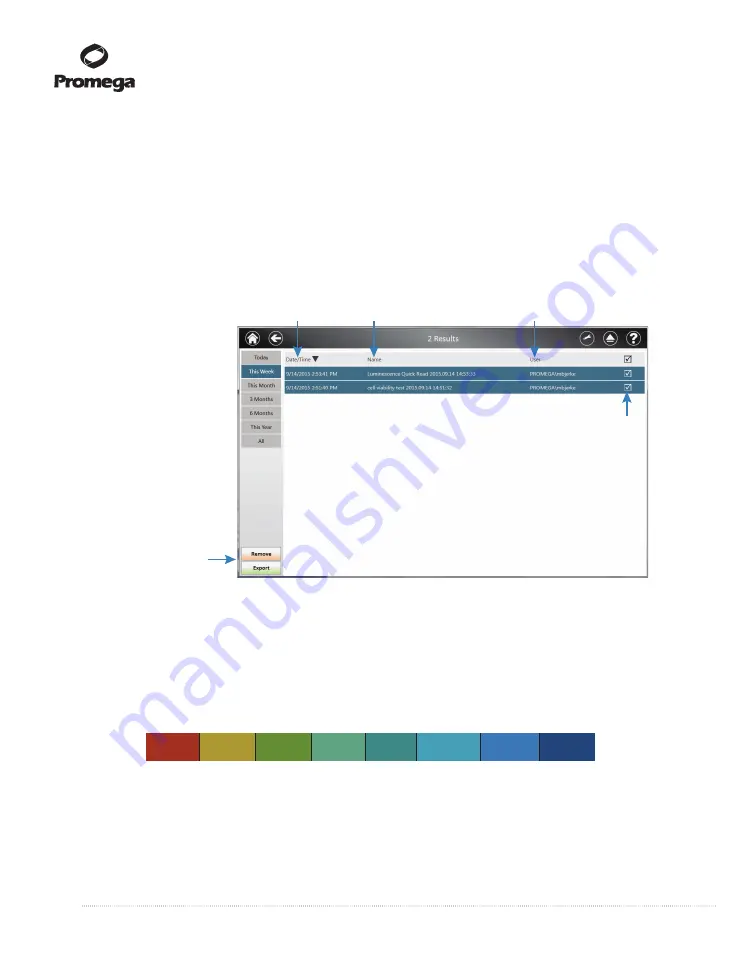
To view results from previous runs, from the
Home screen
, tap the
Results
button.
a.
In the Left Navigation column the user can view results by
today
,
this week
,
this month
, the l
ast three
months
, the
last 6 months
,
anytime this year
or
all
of the results.
b.
Select the result file of interest to view the results.
13615T
A
View results within a group by sorting on date/time, name or user.
Export or remove
1 or more results.
Select to remove
or export file.
Figure 30. GloMax
®
Navigator Results Screen.
2.
To view results in real-time as a protocol is running, the plate map will automatically appear on the screen,
and the data will appear as they are collected. If more than one measurement is taken, each result may be
displayed by selecting the step in the left navigation column.
Results are shown in a heat map format to indicate wells with higher or lower signals in comparison to
the entire plate (Figure 32). When the data are collected, the software automatically scales the color
selection, assigning the highest values red and the lowest values blue, along a gradient.
11
834M
A
7.56e+07 1.02e+07 1.03e+06 9.82e+04 1.31e+04 3.22e+03
298
72
Figure 31. Example GloMax
®
Navigator Results heat map colors.
Within the plate map, each individual sample may be viewed by tapping the well of interest.


