70
LogTag Analyzer User Guide (2.0)
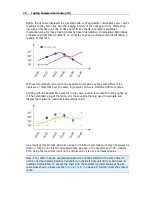
Before the data are displayed in an average tab, LogTag Analyzer normalizes every chart's
readings so they fall in line with the logging interval of the LogTag with the shortest log
interval, in this case unit (B). It does not shift any charts, but rather calculates a
theoretical value for those reading times by linear interpolation. Interpolation determines
probable environmental conditions, i.e. what the LogTag would have recorded if taking a
reading at that time.
Without this method, it would not be possible to compare LogTags with different log
intervals, or units that have the same log interval, but were started at different times.
Starting with the earliest time present in the chart, a value is created for each LogTag as
if it had recorded a log at that time. It is those values that are used to calculate and
display the minimum, maximum and average charts.
As a result of this process, absolute values for minimum and maximum may not always be
shown if they do not fall on normalized times, as seen in the example at 10:35 - despite
21ºC being the maximum it will not be displayed as it is not a normalized value.
Note: The charts in above example are based on LogTags started at the same time. If
unit (A) had been started earlier, depending on the start time unit (B) may also have its
readings interpolated. To ensure the chart with the shortest log interval always has its
real values shown, please use the
Aligning Charts
(on page 67) function from the context
menu.
Summary of Contents for Analyzer
Page 1: ...2 0...
Page 23: ...Chapter 3 Quick Start Guide 23 Only flashes if no alert condition is present...
Page 170: ......

