Page 94
11.D Lead/Lag Slave Diagnostics
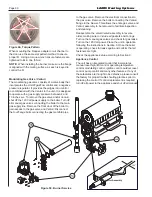
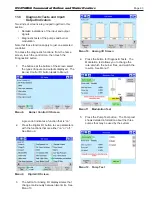
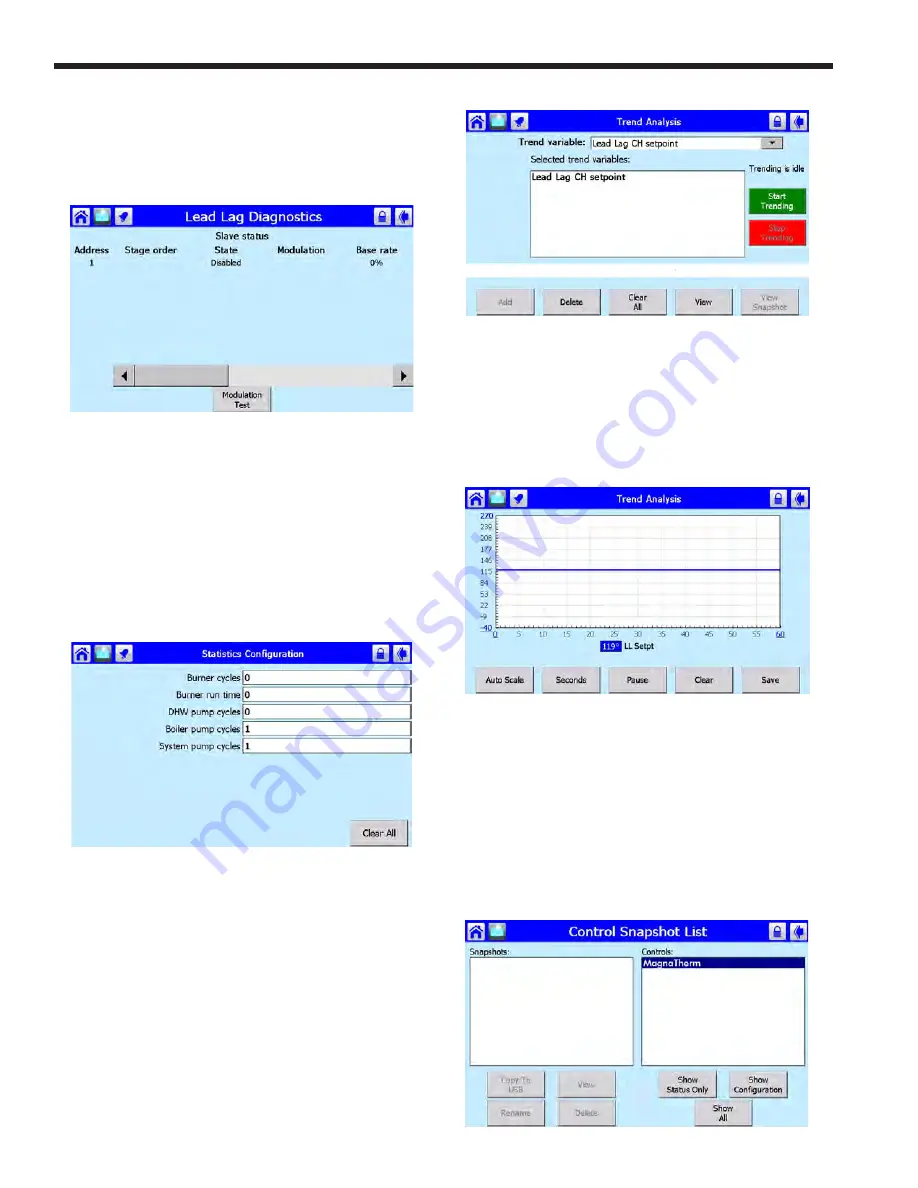
The control system includes a diagnostic screen that
lists some information on the Lead/Lag slaves in the
system. See Menu 13
Menu 13. Lead/Lag Diagnostics
Use the left- and right-arrows to see all of the
columns in the display.
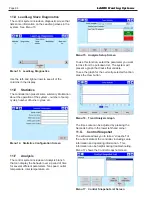
11.E Statistics
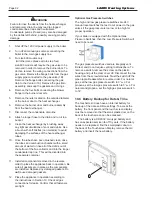
The controller can present some summary information
about the operation of the system – number of pump
cycles, number of burner cycles, etc.
Menu 14.
Statistics Confi guration Screen
11.F Analysis
The control system includes an Analysis branch
that can display the behavior over a period of time
for several different parameters: fan speed, outlet
temperature, inlet temperature, etc.
Menu 15. Analysis Setup Screen
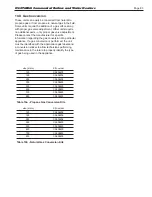
To use this function, select the parameter you want
to track from the pull-down list. The system will
present a graph that tracks that variable.
To see the graph for the currently-selected function,
press the View button.
Menu 16. Trend Analysis Graph
The time scale can be adjusted by pressing the
Seconds button in the lower left-hand corner.
11.G
Control Snapshot
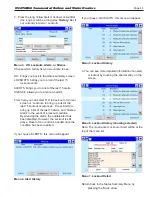
The software allows you to take a “snapshot” of
the current state of the controller, including setup
information and operating information. This
information can be helpful during troubleshooting.
Menu 17 shows the Control Snapshot screen.
Menu 17. Control Snapshot List Screen
LAARS Heating Systems
Summary of Contents for Neotherm NTH
Page 4: ...LAARS Heating Systems...
Page 36: ...Page 36 Figure 22 Hydronic Piping Single Boiler Zoning with Circulators LAARS Heating Systems...
Page 52: ...Page 52 Figure 36 Ladder Diagram 7 H Ladder Diagram LAARS Heating Systems...
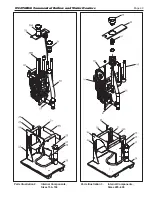
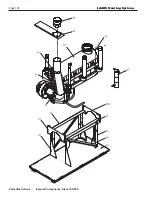
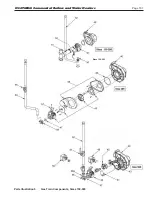
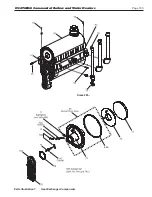
Page 100: ...Page 100 Parts Illustration 4 Internal Components Sizes 750 850 LAARS Heating Systems...
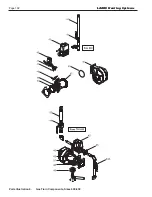
Page 102: ...Page 102 Parts Illustration 6 Gas Train Components Sizes 600 850 LAARS Heating Systems...

