Kroks Arinst SSA-TG R2 User Manual Download Page 55

Portable spectrum analyzer Arinst SSA-TG R2                                                                                         6 April 2019 


                                         www.arinst.net   |   www.arinst.ru    |    www.kroks.ru


 55


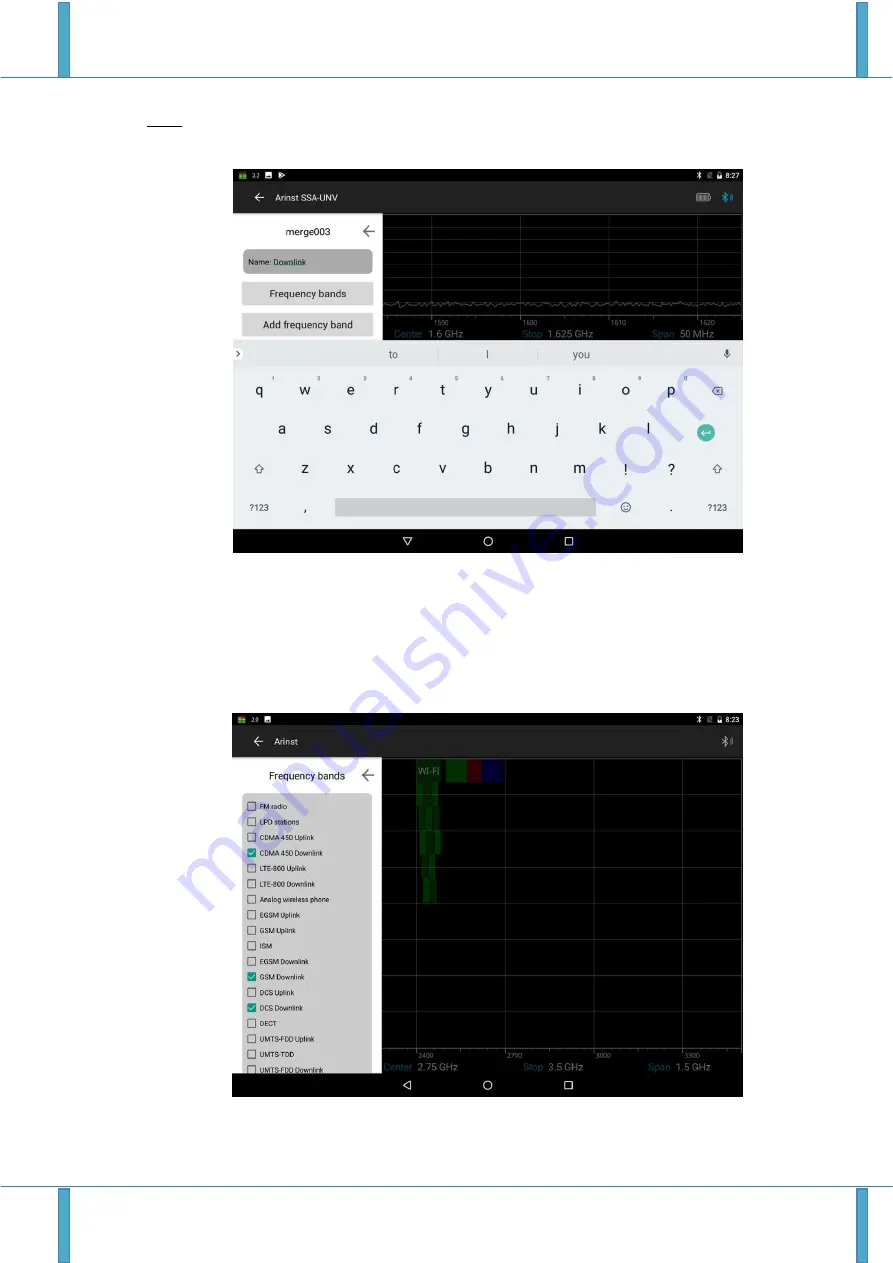
Note. By default, the new lists of frequency ranges are automatically assigned the name "merge" with 

an indication of the sequence number. For example, merge003.


Figure 80

     Entering the name of the new range list


9.5.4.  Set  the  frequency  bands  that  will  be  included  in  the  new  list  (

in  our  example,  Downlink

).  Fre-

quency ranges can be set in two ways: 

a)  By  clicking  on  the 

Frequency  bands

  button  (Figure  80),  select  the  desired  bands  from  the  list  of 

preset  bands,  as  shown  in  Figure  81.  In  our  example, 

GSM  Downlink,  DCS  Downlink 

and 

CDMA  450 

Downlink 

are selected. 


 igure 81     Selecting ranges from the list 


Summary of Contents for Arinst SSA-TG R2

Page 1: ...SCIENTIFIC AND PRODUCTION COMPANY PORTABLE SPECTRUM ANALYZER WITH BUILT IN SIGNAL GENERATOR Arinst SSA TG R2 USER MANUAL Article 1484...

Page 2: ...the analyzed signal 10 7 5 Menu for setting markers and signal peaks 11 7 6 Signal generator frequency and power setting menu 12 7 7 Setting parameters and measuring the reflection coefficient S11 16...

Page 3: ...Determination of amplitude frequency response 47 9 3 Reflection coefficient measurement 49 9 4 Measurement of standing wave ratio SWR 51 9 5 Displaying multiple frequency bands of signals 54 9 6 Poin...

Page 4: ...vous or mental abnormalities or lack of experience and knowledge that impede the safe operation of the device without supervision or training use by children for games 2 SPECIFICATIONS 2 1 Technical c...

Page 5: ...a fault is detected stop operation immediately and turn off the instrument 4 1 6 If you need to leave the workplace turn off the device and other devices Do not leave the de vice running unattended 4...

Page 6: ...or TG OUT 6 Indicator of the mode of operation of the device 2 Antenna input RF IN MODE 3 Housing 7 Battery charging indicator CHARGE 4 Color resistive screen 3 2 8 Connector mini USB 5 Button on off...

Page 7: ...and hold the POWER button 5 for 1 2 seconds The operation mode LED 7 MODE will flicker a series of flashes Screen 4 turns on and the signal s spectrogram will be displayed on it igure 4 Turning on the...

Page 8: ...e The values of the initial Start the final Stop and the central Center frequencies of the measured signal change 7 1 5 To move the markers left right in frequency briefly press the button 13 MKR on t...

Page 9: ...to the menu press and hold the button 12 for about 2 seconds FREQ igure 7 Menu of setting the frequency of the overview 7 3 2 Each of the options of the submenu has its own purpose Center setting the...

Page 10: ...button 14 MENU 7 4 Setting the main parameters of the amplitude of the analyzed signal 7 4 1 To set the amplitude parameters of the analyzed signals enter the main menu of the device figure 6 by pres...

Page 11: ...signal are displayed on the screen and a spectrogram of red color is built on the points of the maximum values Trace minimum when this mode is activated the minimum signal values are displayed on the...

Page 12: ...the maximum value of the signal amplitude over the entire frequency range The design of the device allows the use of up to four multi colored peak indicators to monitor changes in the amplitudes of th...

Page 13: ...ower of the generator output signal as in Figure 14 igure 14 Setting the frequency and power output of the generator 7 6 3 Setting the frequency of the output signal of the internal generator Generato...

Page 14: ...ameter Figure 14 The setup submenu appears as shown in Figure 16 igure 16 Enabling the mode of determining the amplitude frequency characteristic 7 6 6 Set the desired attenuation level of the Input A...

Page 15: ...rator output signal and analyz er are inaccessible Set the frequency range of the generator output signal and analyzer before normali zation Without turning off the device turn on the equipment under...

Page 16: ...11 S11measure S11corr In this case the minimum level of the measured coefficient S11 is set by the calibration S11load that is S11min S11load S11corr Screenshots presented by you confirm this 7 7 1 To...

Page 17: ...tput Open OPEN calibration standart RF IN Antenna input Short SHORT calibration standart TO TG OUT Measuring bridge input Load LOAD calibration standart TO RF IN Measuring bridge output DUT Device und...

Page 18: ...asuring the standing wave ratio SWR 7 8 1 To measure the standing wave ratio you must select the SWR mode Figure 21 igure 21 Enabling SWR mode Note The standing wave ratio is measured in SWR mode The...

Page 19: ...wiring diagram in figure 19 Output of the reflected signal from the measuring bridge port TO RF IN connect to the antenna input of the device 2 RF IN Connect in series the loads from the standard set...

Page 20: ...device with the Android operating system the program to control the spectrum analyzer Arinst SSA spectrum analyzer must be installed Download the program Arinst SSA on Google Play To work correctly w...

Page 21: ...press Del To refuse to enter a value click Cancel Note Depending on the device that converts the signal before the receiver enters the device the nu merical value of attenuation can be entered both p...

Page 22: ...e of the scanned frequencies the frequency of the internal signal generator settings for measuring the fre quency response and SWR 7 10 3 To save the new settings click on the image of the floppy disk...

Page 23: ...martphone If this control program is not installed on your tablet smartphone you need to download and install it Download Arinst SSA from Google Play 8 2 3 Turn on the device as indicated in p 6 1 of...

Page 24: ...ues of the initial Start and final Stop frequencies of the analyzed signal the center frequency Center and the entire Span frequency range of the analyzed signal are displayed Displays the resolution...

Page 25: ...its software 8 3 3 To exit the main menu click on any free point on the screen of the tablet smartphone 8 4 Management features 8 4 1 To move the frequency scale touch it with your finger on the table...

Page 26: ...his case the error in measuring the signal power can reach 6 dB This mode is used for rapid detection of signals and is not intended for accurate power measurements To increase the measurement accurac...

Page 27: ...external converter set the offset frequency grid by entering the Offset menu Enter the numeric value of the frequency grid con stant offset as shown in figure 33 igure 33 Entering the numerical value...

Page 28: ...their names Region presets custom installation of the markings of the frequency bands Add region adding frequency range markings Remove all regions remove all markings 8 5 11 Figure 35 shows an examp...

Page 29: ...f horizontal grid lines Step specifies the increment step 1 5 10 dB hand modification of the scale of amplitudes Ref Offset shifts the amplitude scale for easy display of the level shifted signal 8 6...

Page 30: ...ablet smartphone 8 6 5 When using an external attenuator or amplifier there is a need to shift the amplitude scale for ease of display shifted by the signal level Enter the Ref Offset menu and enter t...

Page 31: ...lect the type of marker measurements Add marker adding a new marker at a given frequency Remove all markers delete all previously set markers 8 7 3 To accurately set the new visual signal amplitude in...

Page 32: ...of the tablet smartphone by changing its fixed fre quency 8 7 5 To set the appearance of the markers on the screen of the tablet smartphone go to the Style menu and select one of the display values o...

Page 33: ...kroks ru 33 igure 42 Displaying the label designation of markers igure 43 Placement of the designation of markers in the form of a table 8 7 7 To select one of four types of marker measurements of a s...

Page 34: ...rs basic and additional Delta amp freq measurement of frequency and amplitude difference between two markers basic and additional 8 8 Menu of automatic measurements of extreme signal values 8 8 1 From...

Page 35: ...ch for the maximum signal value Continuous as shown in Figure 47 In this case the marker will automatically follow the maximum signal value igure 47 Automatic tracking of the maximum signal value 8 8...

Page 36: ...frequency enable the Auto option as shown in figure 49 In this case the maximum signal level marker will be placed automatically in the center of the tablet smartphone screen igure 49 Tracking signal...

Page 37: ...After setting the required number of markers go to the Multi peak menu and click the Run command as shown in Figure 51 If necessary use the cyclic repeat option Repeat Figure 51 Enabling installed mar...

Page 38: ...Trace as shown in Figure 53 igure 53 Menu for processing the displayed measurement results 8 9 2 Trace mode displays the results of mathematical processing of measurements Mathematical processing of...

Page 39: ...ccumulation as in Figure 55 Normal single data accumulation mode according to the specified number of scans Sliding sliding data accumulation mode Figure 55 Select the type of accumulation of data for...

Page 40: ...n in the up per right corner of the tablet smartphone screen figure 57 Figure 57 Graph of the average result of scans 8 9 7 Max Hold mode allows you to display the maximum measurement results for mult...

Page 41: ...set the required number of scans in the range from 4 to and click the Run command Figure 59 The minimum averaged measurement will be displayed on the tablet smartphone screen with a green graph igure...

Page 42: ...n the display mode of the maximum and minimum measure ment result The red graph shows the maximum averaged measurement result The minimum averaged measurement result is displayed in green graph To res...

Page 43: ...rol program figure 63 igure 63 Selecting the language of the control program interface 8 10 3 In addition to selecting the interface language you can optionally change the display settings Show marker...

Page 44: ...e menu you can save files Save with data frequency bands etc to down load frequency bands and data from the memory card of your tablet smartphone Figure 64 Menu of loading and saving data 8 12 Notific...

Page 45: ...oftware version of the device and the device number figure 66 To check the availability of a new software version of the device click the Check for update button If a new version of the instrument sof...

Page 46: ...g on the characteristics of the device under test set the oscillator frequency in the range from 35 to 6200 MHz for example 1000 MHz and the Generator power value in the range from 15 to 25 dBm In our...

Page 47: ...9 2 1 In the Generator menu turn on the Tracking mode and set the value of the Generator Power in the range from 15 to 25 dBm depending on the equipment under study Set the desired attenuation level o...

Page 48: ...l Note After normalization the setting of the frequency range of the signal under study becomes una vailable Set the frequency range of the signal under study before normalization 9 2 5 Without turnin...

Page 49: ...s special attention since a signal exceeding 10 dBm can damage the input circuit of the device igure 71 Amplitude frequency characteristic of the test equipment 9 3 Reflection coefficient measurement...

Page 50: ...cifically designed for use with ARINST spectrum analyzers 9 3 5 Connect the output of the signal generator 1 TG OUT of the device to the input of the measur ing bridge TO TG OUT according to the wirin...

Page 51: ...thmic grid with vertical axis in dB The horizontal axis displays the specified frequency range of the signal figure 74 igure 74 Graph of the reflection coefficient in a given frequency range 9 4 Measu...

Page 52: ...te once for SWR and S11 modes provided that the connectors and cables of the test circuit do not change Note To measure the standing wave ratio SWR you must use a directional coupler or measuring brid...

Page 53: ...ds Reset open calibration Reset short calibration and Reset load calibration Connect the test equipment DUT to the TEST port of the measuring bridge and measure the standing wave ratio Note Standing w...

Page 54: ...et smartphone screen enter the frequency range operating menu Frequency and select the Frequency merges tab figure 78 igure 78 Selecting the gluing mode of ranges 9 5 2 Create a new list of simultaneo...

Page 55: ...mple merge003 Figure 80 Entering the name of the new range list 9 5 4 Set the frequency bands that will be included in the new list in our example Downlink Fre quency ranges can be set in two ways a B...

Page 56: ...re 82 In our ex ample the frequency range UMTS FDD Downlink is introduced For inclusion in the list of the range of input frequencies click Add Figure 82 Input of the initial and final frequencies of...

Page 57: ...of frequency graphs from the list of ranges on the screen 9 5 7 To exit the range list display mode slide your finger from left to right from the edge of the tablet smartphone screen and in the Freque...

Page 58: ...curacy of the modem s signal strength measurement Accurate pointing of the antenna to the base station in the short est time is possible with the use of a spectrum analyzer 9 6 2 Install the antenna o...

Page 59: ...itial Start and final Stop frequency range as in figure 88 igure 88 Entering the frequency range of the signal overview 9 6 4 Enter the menu of statistical and mathematical processing of the displayed...

Page 60: ...let smartphone screen the average maximum signal level will be displayed in red figure 90 igure 90 Displaying the maximum signal level 9 6 6 Move the antenna watching the change in the maximum value o...

Page 61: ...the USB connector of the power supply or USB connector of the computer laptop 10 2 3 Turning on the LED indicator 7 CHARGE informs about the beginning of the battery charg ing process The process of c...

Page 62: ...screws 16 of the back cover 18 of the device Figure 92 Figure 92 Disassembly of the instrument case 10 3 5 Carefully remove the upper part of the housing 3 Slide along the guide slots from the bottom...

Page 63: ...rature at which the instrument is stored can have a significant effect on the self discharge rate of the battery 10 4 4 Keep the device and its accessories out of the reach of children 10 4 5 When tra...

Page 64: ...r for repair 6 The device does not support connection to external devices via Bluetooth Bluetooth data transmission is not enabled in the device Enable data transfer in accord ance with p 7 9 of this...

Page 65: ...ects of the Goods caused by exposure to virus programs interference with the soft ware or use of third party software non original defect caused by an act of force majeure e g earthquake fire lightnin...

Page 66: ...connected and configured Bluetooth adapter for wirelessly controlling the spectrum analyzer via the Bluetooth communications protocol 2 Installing the application on a PC to manage the spectrum analyz...

Page 67: ...ing a virtual port virtual_com_port_driver_pc Installation file of the application to control the analyzer using a PC ArinstSSADesktopClien tInstaller exe Figure A3 Unzipped archive file 2 4 Install t...

Page 68: ...virtual port virtual_com_port_driver_pc Figure A5 The folder contains drivers for 32 bit and 64 bit Windows operating systems Note To determine which Windows operating system 32 bit or 64 bit is inst...

Page 69: ...it for the device driver installation wizard to complete The window will show the name of the driver STMicroelectronics Virtual COM Port and its status Click Finish to exit the device driver instal la...

Page 70: ...STMicroelectronics Virtual COM Port In our example in Figure A8 the created virtual port named STMicroelectronics Virtual COM Port is des ignated as COM 3 Figure A8 Determination of the virtual port...

Page 71: ...ia Bluetooth Attention Before connecting the spectrum analyzer to a PC via a Bluetooth wireless connec tion make sure that your PC is equipped with a Bluetooth adapter 1 4 1 Turn on the spectrum analy...

Page 72: ...the list of devices that can be connected to your PC Figure A11 Figure A11 Selecting the type of device to add 4 4 The PC operating system will search for all active Bluetooth devices The devices ava...

Page 73: ...ouble clicking on the shortcut located on the desktop of your PC In the Arinst SSA application window that opens click on the Bluetooth symbol in the upper right corner In the Devices window that appe...

Page 74: ...will turn off The inter face of the spectrum analyzer control program is similar to the interface described in Section 8 of this Op eration Manual Figure A15 Spectrum Analyzer connected to PC via Blue...

Reviews: