39
65-0315—02
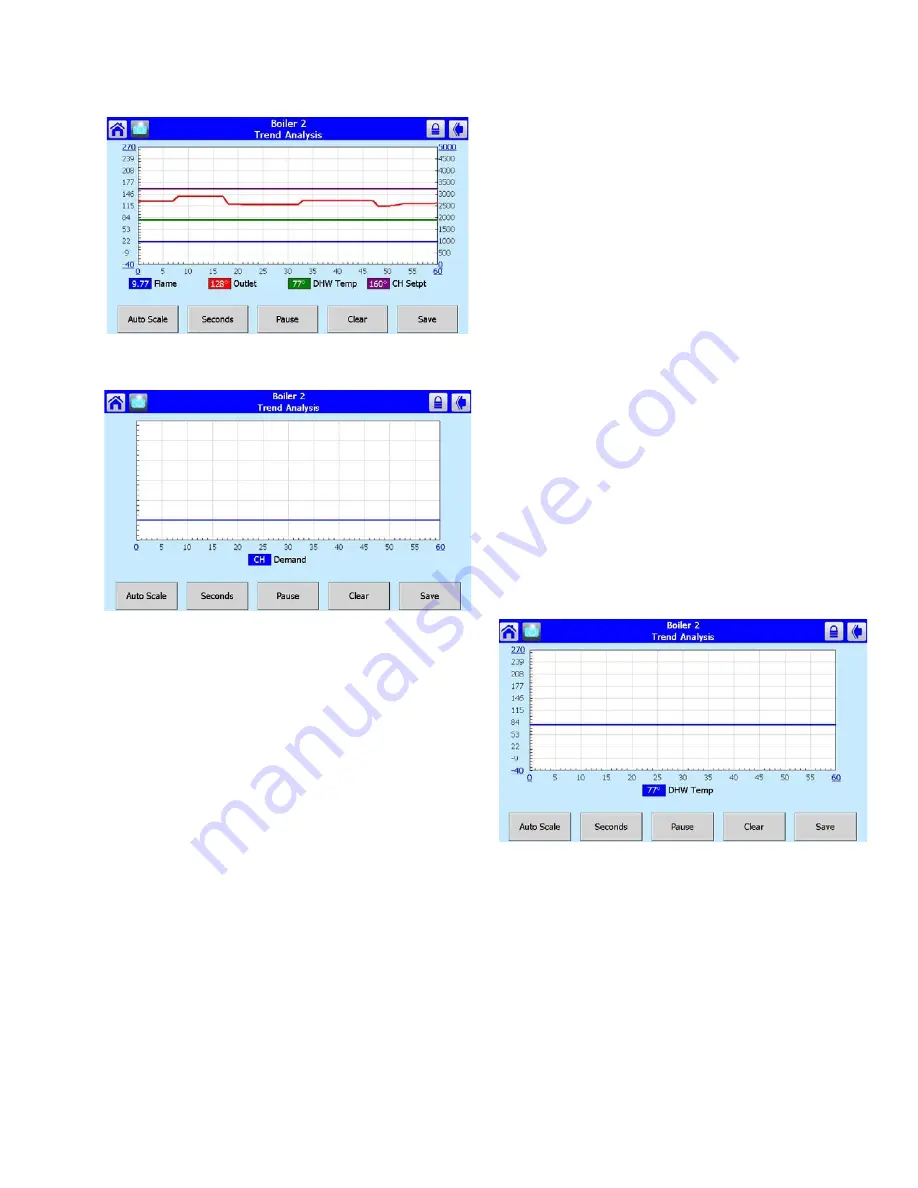
Fig. 89. Trend analysis page with firing rate.
Fig. 90. Trend analysis page with demand source.
If any of the status variables has degrees as a unit of
measurement, degrees is used for the main Y axis (on the left
of the graph). The status variables selected are saved and are
displayed by default when the trend analysis menu page is
first displayed. Status data is updated on the graph with new
status at the same rate as the sample time period selected.
The current sample time period is displayed in a button on the
page (in Fig. 89 and 90, the button is “Seconds”).
Status older than the sample time period is dropped from the
right end of the curve as newer status appears on the left end
of the curve.
Trend data can be viewed in intervals of Seconds (0-60 sec),
Minutes (0-60 min.) Hours (0-24 hr.) or Days (0-30 days).
NOTE: Full graphs require that the S7999D has been
monitoring the R7910 or R7911 for the complete
time period. Partial graphs display if this is not
the case.
The buttons at the bottom can be used to change the view of
the graph. The user can change the sample rates of the
display by pressing the Seconds, Minutes, Hours, or Days
button (the button changes depending on what sample rate is
currently displayed).
The smallest measurement interval is a single whole digit (no
fractional precision) when the entire range exceeds 10 units,
e.g., 20–30 degrees.
Pressing the Stop button will pause trend data updates of the
graph. The graph “freezes” the view when stopped. However,
trend data sampling from the R7910 or R7911 continues
regardless whether the graph update is stopped or not.
Restarting the updates causes the graph to be refreshed with
the latest data samples.
Pressing the Clear button will clear the trend sample data for
an R7910 or R7911. All trend data for the R7910 or R7911 is
cleared including status variables that are not included in the
graph. The user is asked to confirm this action before
proceeding.
A snapshot of the trend analysis graph can be taken and
saved to the S7999D. The user is asked to confirm the save
before it occurs.
NOTE: While this snapshot is saved, trend data sam-
pling for all R7910’s or R7911’s is temporarily
halted. Gaps or static level values occur in the
trend data as a result.
The date and time that the snapshot is taken is stored with the
snapshot. Only the status variables displayed in the graph are
stored in the snapshot. All raw sample data for the status
variables are stored so that any sample rate can be viewed
offline.
Sample data stored in snapshot is either the real-time status
at the time that the Save button is pressed or it is the sample
data at the time that the graph is stopped.
Special case trend analysis graphs for PID tuning can be
viewed for CH, DHW, and Lead Lag demands.
Fig. 91. PID Trend analysis page.
Data included in the PID analysis graph are:
• Sensor temperature (outlet for CH, DHW for DHW, and
header for Lead Lag)
• Setpoint (for corresponding demand source)
• Burner firing rate
• Hysteresis on (for corresponding demand source)
• Hysteresis off (for corresponding demand source)
The default sample rate is 15 sec periods (a tick mark on the
X axis for every 15 second period, with minutes displayed
every 4 tick marks).
Special case trend analysis graph for R7910/R7911 vessel
heat exchange can be selected.


