


HD2010UC
- 21 -
V4.2
Level distribution of probabilities
This function is available with “Advanced Data Logger” installed.
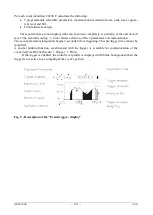
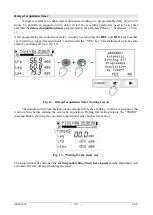
Fig. 6 - Description of the distribution of probabilities display
The figure shows the distribution of probabilities of the A weighted equivalent level with a
0.125s sampling interval. The vertical axis shows the sound levels in decibels and the probabilities
are on the horizontal axis.
The display shows the sampling interval in the left lower corner and the chosen measurement
parameter for the statistical analysis in the first line, to the left of the status indicator, and the possi-
ble overload indicator.
The amplitude of the vertical scale of the displayed graph corresponds to 5 divisions. The am-
plitude of each division is called “scale factor” of the graph and appears in the middle of the vertical
axis. This parameter is selectable in real time among 20dB, 10dB or 5dB by division. These corre-
spond to the 2dB, 1dB or 0.5dB classes in the graph. The scale factor can be set using the RIGHT
(zoom +) and LEFT (zoom -) keys.
Use the UP and DOWN arrows to set the graph full scale with steps equal to the selected scale fac-
tor. In this way, the graph can be shifted UP or DOWN according to the pressed key.
An “analogue” bar indicator on the display right side provides the non-weighted instantaneous
level of the input sound pressure level, as for the SLM mode bar.
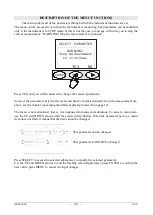
The parameter chosen for statistical analysis can be changed without accessing the menus, but
simply using the SELECT keys, the four arrows UP, DOWN, LEFT and RIGHT and ENTER (for
more details, see "Selecting Parameters " on page 15).
Using the Cursors
To activate cursors on the graph, press CURSOR on the keypad. If you press CURSOR re-
peatedly, either L1 or L2 cursor, or both
∆
L cursors in “tracking” will be activated in succession:
the selected cursor will flash. Use the LEFT and RIGHT arrows on the keypad to move the selected
cursor on the graph.
The second line at the top of the display shows the level and central frequency of the class and the
relevant probability indicated by the active cursor, or the probability for the levels in the interval be-
tween the two cursors when they are both active.
Press CURSOR again to disable the cursors.
Summary of Contents for DeltaOHM HD2010UC
Page 2: ...HD2010UC 2 V4 2 ...
Page 129: ...HD2010UC 129 V4 2 NOTES ...
Page 130: ...HD2010UC 130 V4 2 NOTES ...
Page 131: ......


