


HD2010UC
- 113 -
V4.2
characteristic nominal frequencies. Random stationary signals will have instead a continuous spec-
trum.
An example of deterministic stationary signals could be a note or a chord played by a musical
instrument, while for random stationary signals the example might concern car traffic noise or air-
conditioning noises.
Non-stationary signals
have sound levels depending both on the period of measurement and on in-
tegration time. The time taken for the analysis is critical for this type of acoustic signals and the fre-
quency analysis has to measure all levels in every band of the spectrum at the same time. The ana-
lyzer suitable to this kind of measurement is called to operate in “real time”. Among the non-
stationary signals we can include talking or impulsive signals, such as a balloon burst.
The calculation of integrated mean values over a given time interval might be used in spectral
analysis of deterministic stationary signals, according to the signal main frequency. If the average
time is at least 3 times higher than the acoustic signal main period, level oscillations are considered
negligible.
To get stable and repeatable levels, the integration time can be adjusted. In this case, consider
that the uncertainty in determining sound levels will depend not only on the integration time, but al-
so on the bandwidth of the filter being examined. In the case of the white noise, the following for-
mula provides the uncertainty due to the statistical error.
int
34
.
4
T
B
u
s
⋅
=
Some acoustic signals can be analyzed in statistical terms. The statistical analysis provides in-
formation complementary to that provided by the calculation of the equivalent level for signals
strongly time dependent. Actually, signals with completely different time evolutions, and, conse-
quently, with an impact completely different on the auditory apparatus, can have the same equiva-
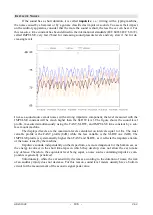
lent level. For example, in the analysis of the noise made by car traffic it is convenient to measure
the so called “statistical levels” (or “percentile levels”) providing a description of noises fluctuating
in time.
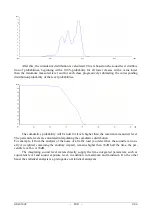
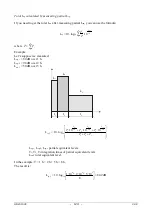
The statistical levels provide the sound level exceeded by a certain percentage of the measur-
ing time, and are represented with the symbol L
x,
where x is the percentage value; for example L
10
gives the sound level exceeded in the 10% of the measuring time. For the calculation of the percen-
tile levels, the analyzer makes a sampling of the Lp sound level, with FAST time constant and A
frequency weighting, at a frequency usually equal to 10 Hz.
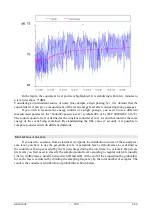
Sound levels measured in this way are classified over the whole measurement range according
to given amplitude intervals, usually a fraction of decibel, called classes. When starting the meas-
urement all classes will have a null number of samples, while at the end of measurements, the clas-
ses will contain a number of samples depending on the rate with which a sound level has been
measured inside the respective interval.
At the end of the measurement time, the distribution of probabilities will be first calculated,
dividing the content of any class by the total number of samples and multiplying the result by 100;
then the cumulative distribution of probabilities will be calculated, having a value of 100% for lev-
els lower than the first class containing at least a sample and taking lower values down to zero for
levels higher than the last class containing samples.
From the definition of the statistical levels it is evident that L
1
will be very near to the maxi-
mum measured level, while L
99
will be very near to the minimum measured level. Therefore, while
levels L
1
, L
5
and L
10
are representative of the peaks of the acoustic signal, L
90
, L
95
and L
99
are rep-
resentative of the background noise.
Other parameters characterizing the sound level have been derived from the statistical levels.
For example, in the measurement of vehicle traffic noise, the “Traffic Noise Index” has been de-
fined as:
Summary of Contents for DeltaOHM HD2010UC
Page 2: ...HD2010UC 2 V4 2 ...
Page 129: ...HD2010UC 129 V4 2 NOTES ...
Page 130: ...HD2010UC 130 V4 2 NOTES ...
Page 131: ......


