


Moxi V
™
User Guide
Page 33
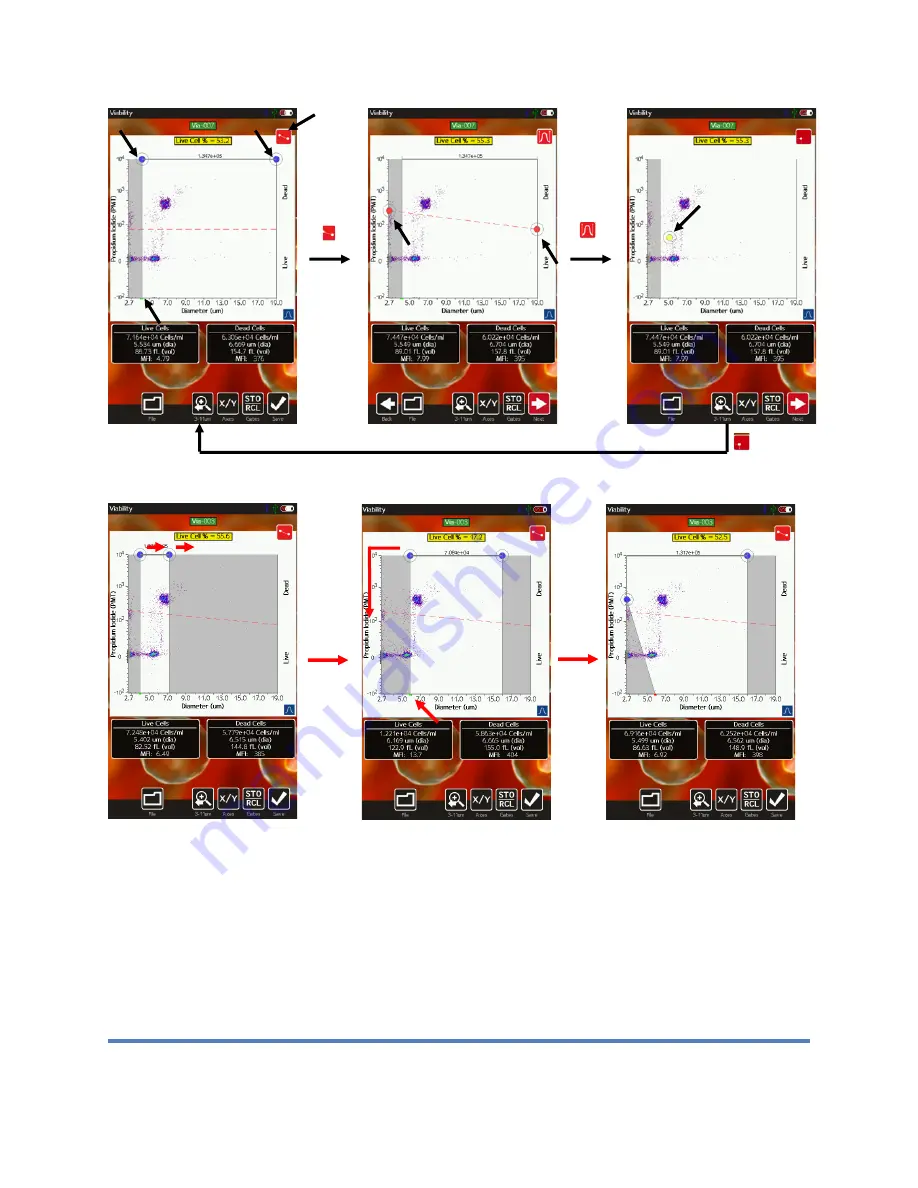
Size Gating of Scatter (Dot) Plots
The results of all fluorescent tests (all tests except for the “Size Histogram” test) are initially
displayed as scatter plots with the size (blue) gates enabled (see image above, left). Gates can
be adjusted by touching and dragging the blue markers around the edges of the scatter plot
(above). Touching the marker at the base of the left gate toggles the marker from green
(unlocked, images above/left and above/middle) to red (locked, image above/right). Touching
the marker again will switch it back to the prior state. Moving the left cursor with base unlocked
(green) results in the base moving synchronously/equivalently with the top left cursor (gate line
is forced to be vertical). Moving the left cursor with the base marker locked (red) anchors the
base point allowing the user to pivot the top point around it (e.g. image above/right). This top


