


Moxi V
™
User Guide
Page 17
test/cassette side, the system will perform a spiral find and laser sweep to find align the laser
ideally to the cassette detection zone (see laser/cassette alignment section).
Cell QC – Initial Test Output (both Single Run and Batch)
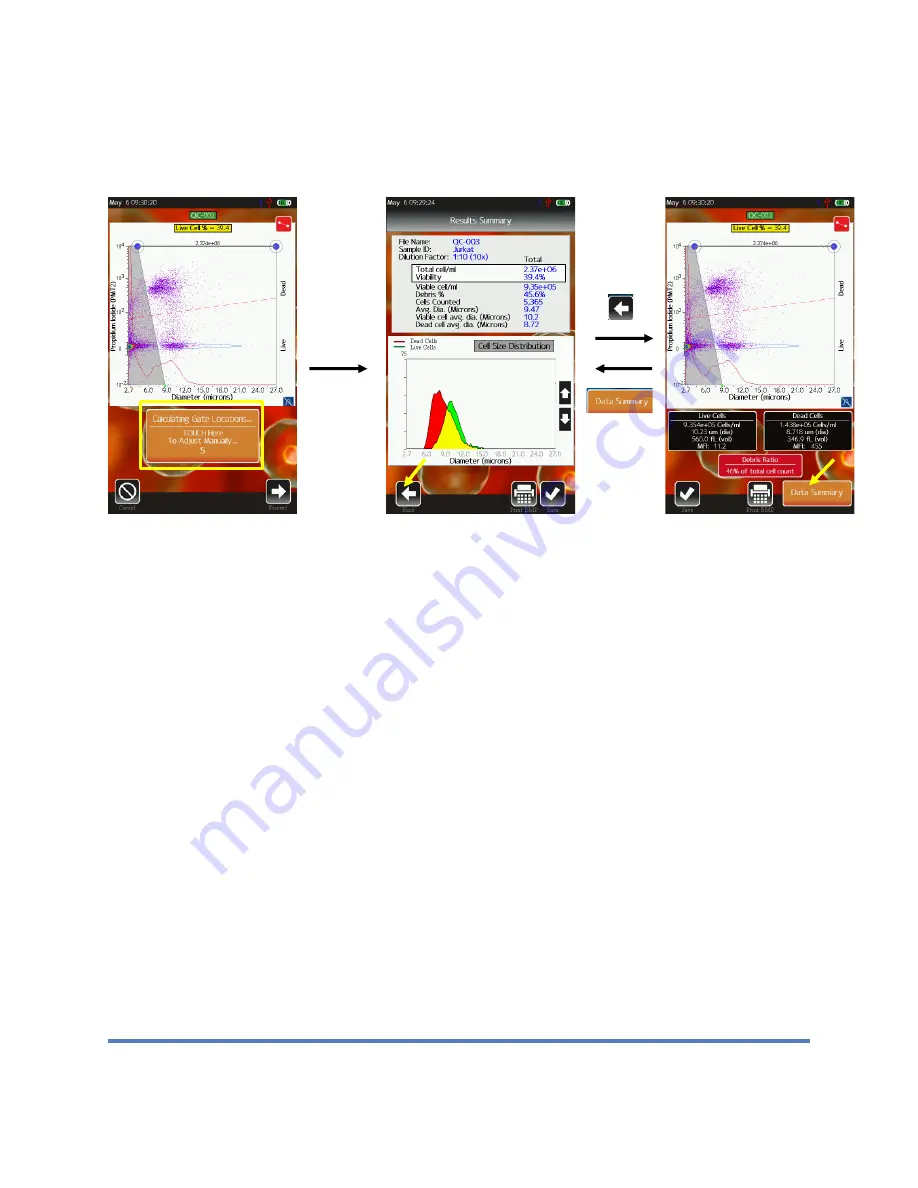
An example of the Cell QC output is shown above. Initially (during and right after acquisition)
the user is shown the raw scatter plot data (image above/left) and given the option (by touching
the orange rectangle) to manually adjust the system’s auto-gate placement. Touching the
orange rectangle will bring the user the scatter plot gating screen (image above/right). If the
user does not touch anything, the simplified “Results Summary” screen (image above/middle) is
displayed. This initial screen is designed to provide a simple representation of all the
cell/sample data based on the system auto-gating of the fluorescence (Propidium Iodide,
Viability) vs Size scatter plot (more detail below) to identify the core cell population (by size)
and determine the viability (by PI fluorescence). The user is provided the opportunity to review
the system gate placement by touching the “Back” button. Touching that button brings up the
standard PIN diode (561nm/LP fluorescence, Propidium Iodide) vs. Size scatter plot (example in
image above/right). Gates can be adjusted by touching and dragging the markers (blue/size,
red/fluorescence, yellow/noise) as described in the “Fluorescence vs. Size Gating” section of
this User Guide. It is recommended that users verify that gate for the initial test/run with any new
sample/cell types. Once verified, the user can simply refer to the simplified test output screen.
The user can return to the simplified “Results Summary” screen by touching the orange “Data
Summary” button under the scatter plot.
The “Results Summary” screen has the test information at the very top. If this test is part of a
batch, the “Batch Name” will be added to that summary (as shown above). The Dilution Factor,
selected by the user during test configuration, is automatically applied to the concentration data
provided below.
Some notes on the data:


