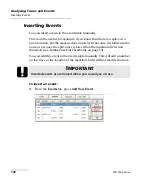
Analyzing Traces and Events
OTDR
149
Setting the Analysis Detection Thresholds
The following examples show how different splice-loss threshold levels
can affect the number of displayed events, especially small non-reflective
events such as those caused by two splices. Three traces are shown,
corresponding to three threshold level settings.
³
Threshold at 0.05 dB
With the threshold set to 0.05 dB, two events are displayed at distances
corresponding to the location of the first and second splices.
³
Threshold at 0.1 dB
Only the first splice is displayed, as the threshold is set to 0.1 dB and
the second splice loss is lower than 0.1 dB.
³
Threshold at 0.15 dB
The first two splices are not displayed, as the threshold is set to 0.15 dB
and the first and second splice losses are lower than 0.15 dB.
Event location
Threshold
at 0.05 dB
Threshold
at 0.1 dB
Threshold
at 0.15 dB
Second splice
First splice
Not displayed
Not
displayed


