XWEB5000 Operation Manual
88/115
1592010600
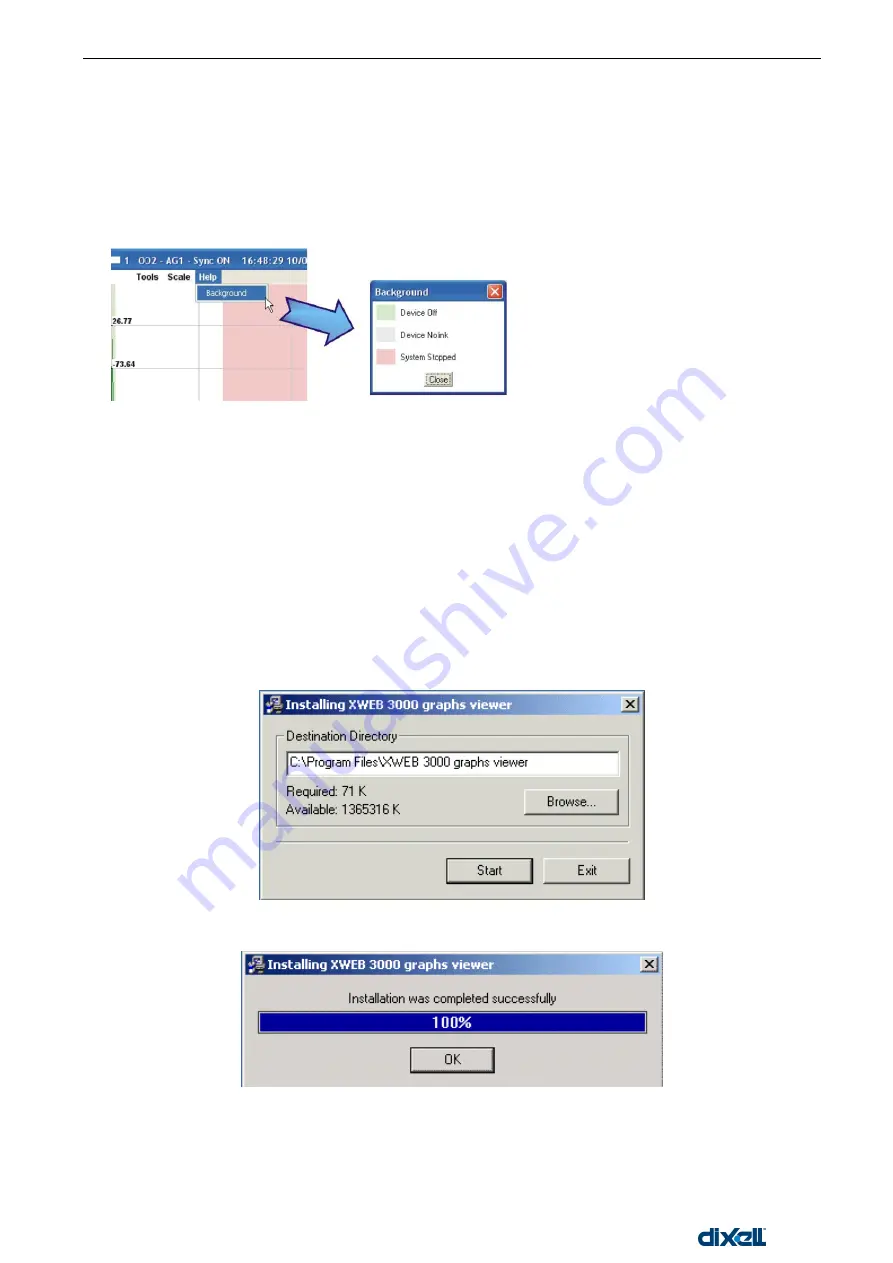
The background colour of the graph
The background colour of the graph changes depending on the status of functioning of the system in that
period of time recording.
White background, for instance, defines a normal period of functioning and data recording.
Green background means instrument off
Grey background means instrument no-link (it does not communicate)
Rose Background means system recording stopped.
Check the assignment of the colour function under “Background” from the “Help” menu.
3.6.1.1
MULTI GRAPH
With this function it is possible to display more than one graph per time. Proceed as usual to fill in the different
field, push “Next Device” button. The actual form is been resetted. The user can pick up to 5 different
controllers. On the top right corner there is a counter, here is displayed the graph number.
3.6.2 DISPLAY THE GRAPHS WITH LOCAL PC
You can also display the graphs without connecting to a remote XWEB. First you need to save locally a
graph(s) (see chapter 3.6.1 Display the graphs with XWEB
“Save a graph format” section). If this is the first
time you want to display a graph locally, you have to install a special software. Insert the XWEB cd-rom and
go to “Utilities” section. Here install “Graph viewer”.
First confirm th
e setup path and push “Start”.
At the end of the procedure this window will appear:
From now on you can find the program “Dixell‟s graphs viewer” inside your PC start menu:
Summary of Contents for xweb 5000
Page 1: ...OPERATION MANUAL...
Page 2: ......


