XWEB5000 Operation Manual
86/115
1592010600
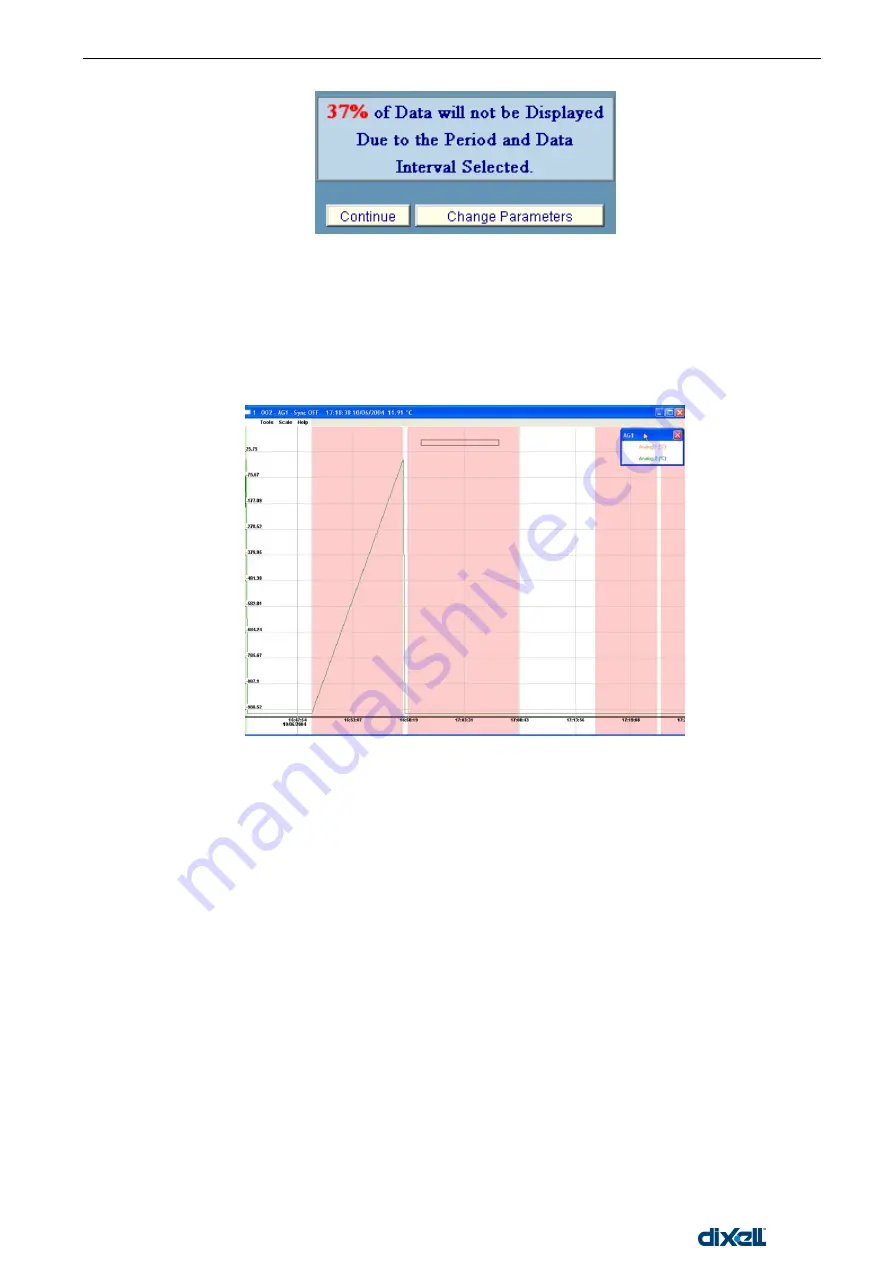
This usually happens whenever the time period is too long. You can also use the “Min. data interval” value. By
default it is set to 5 minutes. Increasing this period you can decrease the amount of data that will be lost. If you
push “Continue”, the system will build a graph using only a partial amount of data. In the example above the
37 percent of data will not be showed. In a
ny case the lost portion is the oldest one. If you push “Change
parameters”, XWEB stops the displaying procedure and you are brought back in the main graphs page.
As soon as the loading procedure ends, you will see something like this:
Zoom in/out procedures
Before executing the zoom it is necessary, if there is more than a graph displayed, to select the desired
graph.
Click, with the left button of the mouse, into the top bar of the information of graph itself.
To zoom in you just have to keep pressed to left mouse button.
To zoom out you just have to keep pressed to right mouse button
Zoom into an area
To enhance the portion of a displayed graph click and keep pressed the left button of the mouse on the
hypothetical top-left corner of the area to zoom.
Than drag the mouse down to the low right corner to complete the window to zoom. If the selected area
have not the proper dimensions click one time outside the area itself to abort the zoom, then repeat the
operation to select the area to zoom.
Otherwise, if you click one time with the left button inside the selected area, immediately this area will be
zoomed to the borders of the graph.
Back to the original size
To resize the graph to its original dimension select from the “Scale” menu the “Reset Size” option.
Summary of Contents for xweb 5000
Page 1: ...OPERATION MANUAL...
Page 2: ......


