30
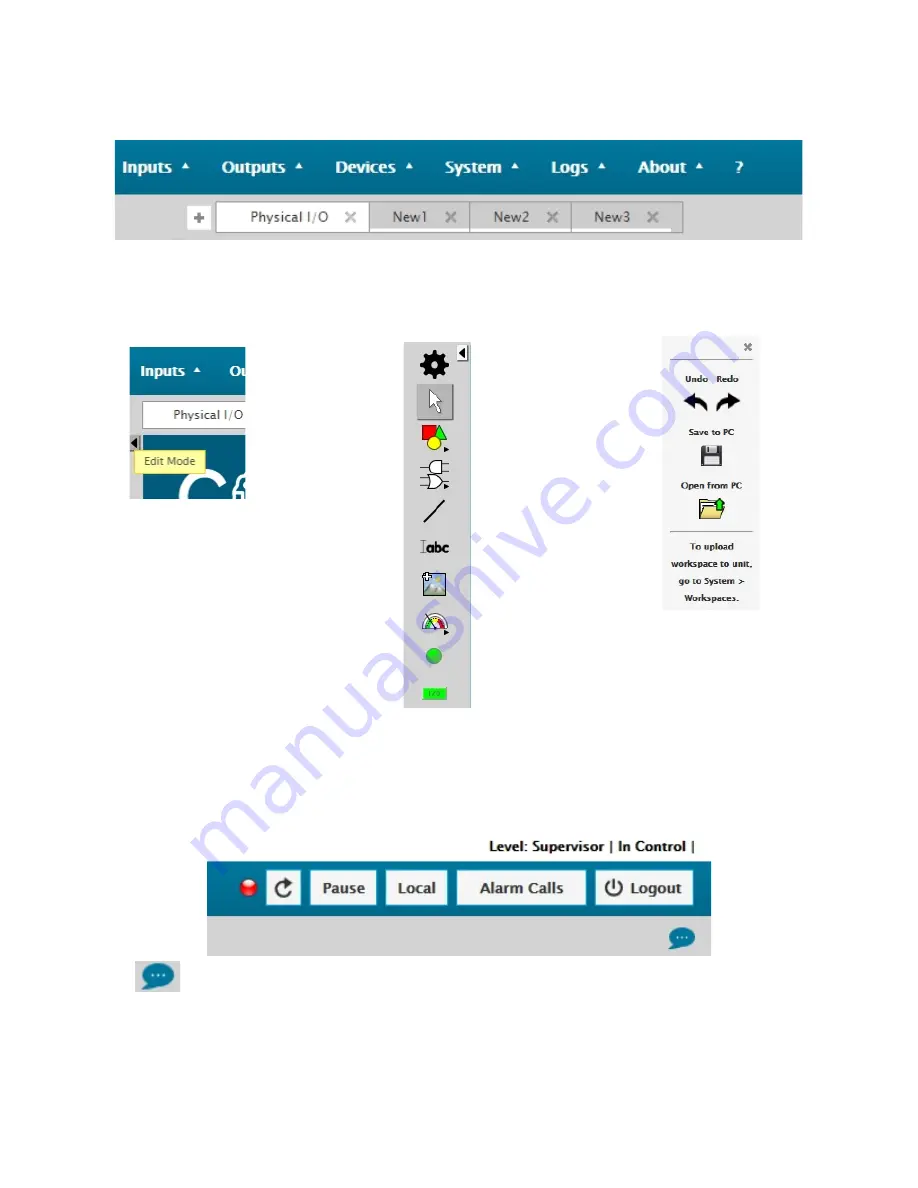
The other menu line, just below the Main menu contains the workspace tabs from which the different panels can be accessed
(note that this menu may be absent if you don’t have any workspace panels configured, or if you are scrolled down on the
page). This is usually where all the I/O activity is visualized. Each and every workspace panel can display any I/O or Flag
using different shapes and colors. Screens can easily be added, edited, or removed. Below is an example:
At the very left of your screen, right below the menus above, a small arrow is visible. Clicking on this arrow pulls-out the
Edit
toolbar, allowing access to graphic tools for building custom workspaces. The Workspace transfer window may also
appear. If it doesn’t, just click on the Gear icon.
The upper right corner menu shows an general alarm-status LED, a data-download refresh button (not to be confused with
the web-page update button (F5 function) on the browser), two buttons to put the unit into Pause or Local modes, an alarm-
call enable/disable button, and a button to logout of the unit. Your current user-level and Control status are also shown. This
last information is important because without control, a user cannot access several areas of the GUI.
The small bubble icon at the bottom of this part of the screen opens a Chat window so that different connected
users can exchange information. This feature is particularly useful when a technician is working at the site, with no cell-
phone or other communications channels available, and there is a need to exchange information with another person at the
NOC or studio for example.


