background image

231

17-1 List Operations

Select the 

LIST

 icon in the Main Menu and enter the LIST Mode to input data into

a list and to manipulate list data.

u

u

u

u

u

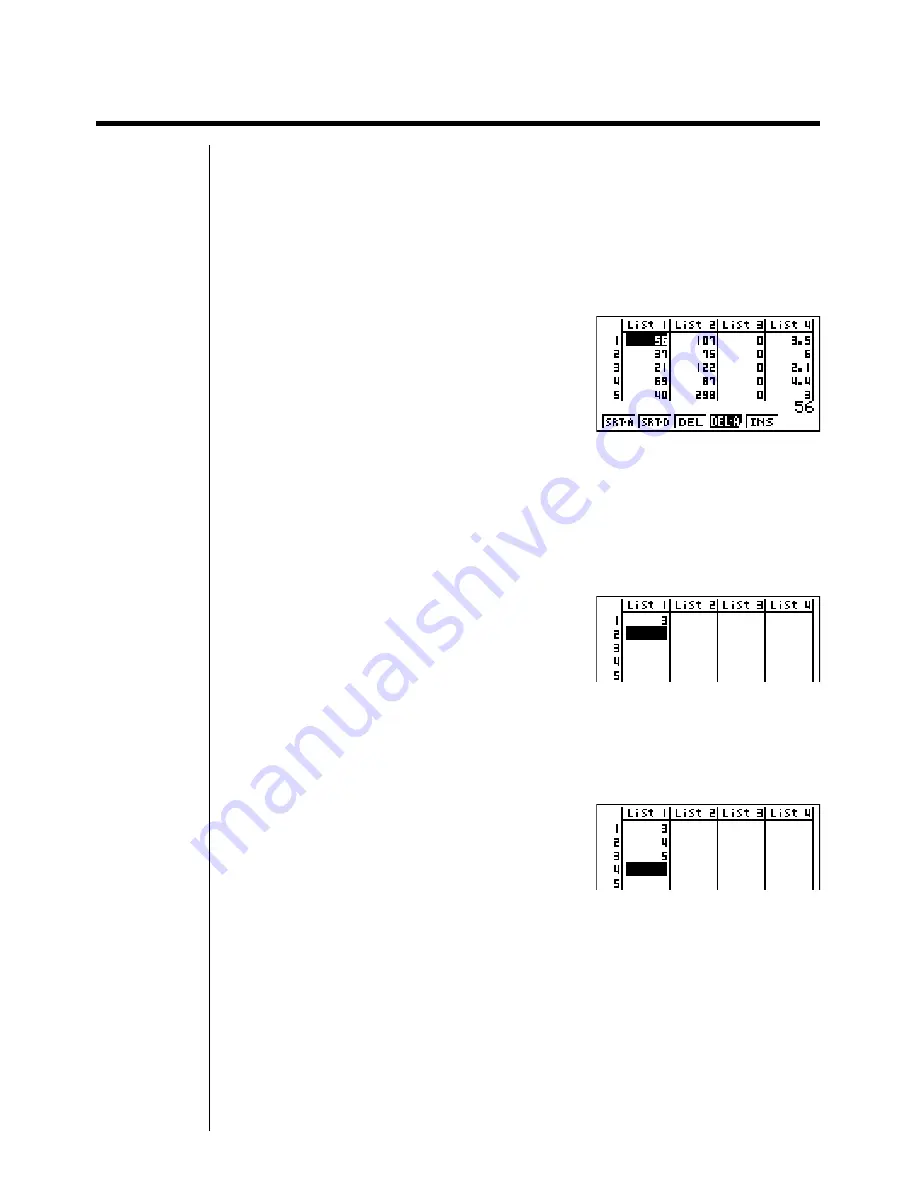
To input values one-by-one

Use the cursor keys to move the highlighting to the list name or cell you want to
select. Note that 

c

 does not move the highlighting to a cell that does not contain

a value.

The screen automatically scrolls when the highlighting is located at either edge of
the screen.
The following example procedure is performed starting with the highlighting
located at Cell 1 of List 1.

1. Input a value and press 

w

 to store it in the list.

d

w

2. The highlighting automatically moves down to the next cell for input.

• Note that you can also input the result of an expression in a cell. The following

operation shows how to input the value 4 in the second cell and then input the
result of 2 + 3 in the next cell.

e

w

c+d

w

Summary of Contents for CFX-9850G PLUS

Page 1: ...E http world casio com edu_e User s Guide fx 9750G PLUS CFX 9850G PLUS CFX 9850GB PLUS CFX 9850GC PLUS CFX 9950GB PLUS ...

Page 2: ...the Main Menu select the GRAPH icon and enter the GRAPH Mode When you do the Graph Function menu appears on the display You can use this menu to store edit and recall functions and to draw their graphs SEL draw non draw status DEL function delete TYPE graph type menu COLR graph color GMEM graph memory save recall DRAW graph draw Memory area Use f and c to change selection CFX indicates COLR is not...

Page 3: ...ck cover from the calculator by pulling with your finger at the point marked 1 2 Load the four batteries that come with calculator Make sure that the positive and negative ends of the batteries are facing correctly 3 Remove the insulating sheet at the location marked BACK UP by pulling in the direction indicated by the arrow 4 Replace the back cover making sure that its tabs enter the holes marked...

Page 4: ...ntrast Use f and c to move the pointer to CONTRAST Press e to make the figures on the display darker and d to make them lighter uTo adjust the tint 1 Use f and c to move the pointer to the color you want to adjust ORANGE BLUE or GREEN 2 Press e to add more green to the color and d to add more orange 8 To exit display contrast adjustment press m The above shows the fx 9750G PLUS screen The above sh...

Page 5: ...een to make data easier to understand Main Menu Display Color Adjustment Graph Function Menu Graph Display Example 1 Graph Display Example 2 Graph To Table Display Dynamic Graph Display Table Graph Numeric Table Recursion Formula Convergence Divergence Graph Example iii CFX ...

Page 6: ...ter the GRAPH Mode and input the following 3 TYPE 1 Y Specifies rectangular coordinates svwf 45 Stores the expression 2 4 COLR 2 3456 Press the function key that corresponds to the color you want to use for the graph 1 for blue 2 for orange 3 for green 3 2 Orng Specifies the graph color J 6 4 6 DRAW Draws the graph You can also draw multiple graphs of different color on the same screen making each...

Page 7: ... Normally once you press a and then a key to input an alphabetic character the key board reverts to its primary functions immediately If you press and then a the keyboard locks in alpha input until you press a again v ...

Page 8: ...Y TABLE vi Page Page Page Page Page Page 128 Page Page Page Page Page 132 113 47 46 2 47 46 154 144 120 369 4 2 27 28 3 46 46 46 46 45 45 45 45 21 20 36 36 36 36 39 36 45 36 47 36 49 49 47 36 45 45 22 49 ...

Page 9: ...Turning Power On And Off Using Modes Basic Calculations Replay Features Fraction Calculations Exponents Graph Functions Dual Graph Box Zoom Dynamic Graph Table Function Quick Start ...

Page 10: ...s Press fh Whenever necessary we ve included samples of what your screen should look like If you find that your screen doesn t match the sample you can restart from the beginning by pressing the All Clear button o TURNING POWER ON AND OFF To turn power on press o To turn power off press o OFF Note that the calculator automatically turns power off if you do not perform any operation for about six m...

Page 11: ...ude mixed arithmetic operators and parentheses the calcula tor automatically applies true algebraic logic to calculate the result Example 15 3 61 1 Press o to clear the calculator 2 Press bf d gbw Parentheses Calculations Example 15 3 61 1 Press bf d gb w Built In Functions This calculator includes a number of built in scientific functions including trigonometric and logarithmic functions Example ...

Page 12: ...FEATURES With the replay feature simply press d or e to recall the last calculation that was performed This recalls the calculation so you can make changes or re execute it as it is Example To change the calculation in the last example from 25 sin 45 to 25 sin 55 1 Press d to display the last calculation 2 Press d twice to move the cursor under the 4 3 Press f 4 Press w to execute the calculation ...

Page 13: ... dh jw Converting a Mixed Fraction to an Improper Fraction While a mixed fraction is shown on the display press d c to convert it to an improper fraction Press d c again to convert back to a mixed fraction Converting a Fraction to Its Decimal Equivalent While a fraction is shown on the display press M to convert it to its decimal equiva lent Press M again to convert back to a fraction Indicates 6 ...

Page 14: ...Quick Start xii EXPONENTS Example 1250 2 065 1 Press o 2 Press bcfa c ag 3 Press M and the indicator appears on the display 4 Press f The 5 on the display indicates that 5 is an exponent 5 Press w ...

Page 15: ...angular coordinates horizontal axis x vertical axis y or polar coordi nates angle θ distance from origin r Example 1 To graph Y X X 1 X 2 1 Press m 2 Use d e f and c to highlight GRAPH and then press w 3 Input the formula v v b v c w 4 Press 6 DRAW or w to draw the graph Example 2 To determine the roots of Y X X 1 X 2 1 Press 5 G Solv 1 ...

Page 16: ...and the X 1 root obtained for Y X X 1 X 2 1 Press 5 G Solv 123456 2 Press 6 g 123456 3 Press 3 dx 4 Use dto move the pointer to the location where X 1 and then press w Next use e to move the pointer to the location where X 0 and then press w to input the integration range which becomes shaded on the display ...

Page 17: ...tersection Y1 X X 1 X 2 Y2 X 1 2 1 Press Zcc1 Grph to specify Graph for the Dual Screen setting 123456 2 Press J and then input the two functions v v b v c w v b cw 3 Press 6 DRAW or w to draw the graphs BOX ZOOM Use the Box Zoom function to specify areas of a graph for enlargement 1 Press 2 Zoom 1 BOX 2 Use d e f and c to move the pointer to one corner of the area you want to specify and then pre...

Page 18: ...a appears in the inactive right side screen DYNAMIC GRAPH Dynamic Graph lets you see how the shape of a graph is affected as the value assigned to one of the coefficients of its function changes Example To draw graphs as the value of coefficient A in the following function changes from 1 to 3 Y AX2 1 Press m 2 Use d e f and c to highlight DYNA and then press w 3 Input the formula aAvxw 12356 4 ...

Page 19: ...R bw to assign an initial value of 1 to coefficient A 1 23456 5 Press 2 RANG bwdwbw to specify the range and increment of change in coefficient A 6 Press J 7 Press 6 DYNA to start Dynamic Graph drawing The graphs are drawn 10 times ...

Page 20: ...ed to the variables of a function Example To create a number table for the following function Y X X 1 X 2 1 Press m 2 Use d e f and c to highlight TABLE and then press w 3 Input the formula v v b v c w 4 Press 6 TABL or w to generate the number table To learn all about the many powerful features of this calculator read on and explore ...

Page 21: ...he manufacturer and its suppliers be liable to you or any other person for any damages expenses lost profits lost savings or any other damages arising out of loss of data and or formulas arising out of malfunction repairs or battery replacement The user should prepare physical records of data to protect against such data loss Never dispose of batteries the liquid crystal panel or other components ...

Page 22: ...h problems it is a good idea to leave 1 or 2 kbytes of memory free unused at all times In no event shall CASIO Computer Co Ltd be liable to anyone for special collateral incidental or consequential damages in connection with or arising out of the purchase or use of these materials Moreover CASIO Computer Co Ltd shall not be liable for any claim of any kind whatsoever against the use of these mater...

Page 23: ... fx 9750G PLUS CFX 9850G PLUS CFX 9850GB PLUS CFX 9850GC PLUS CFX 9950GB PLUS ...

Page 24: ...tial Calculations 55 3 3 Quadratic Differential Calculations 58 3 4 Integration Calculations 60 3 5 Maximum Minimum Value Calculations 63 3 6 Summation Σ Calculations 65 Chapter 4 Complex Numbers 67 4 1 Before Beginning a Complex Number Calculation 68 4 2 Performing Complex Number Calculations 69 Chapter 5 Binary Octal Decimal and Hexadecimal Calculations 73 5 1 Before Beginning a Binary Octal Dec...

Page 25: ...apter 10 Sketch Function 153 10 1 Before Using the Sketch Function 154 10 2 Graphing with the Sketch Function 155 Chapter 11 Dual Graph 167 11 1 Before Using Dual Graph 168 11 2 Specifying the Left and Right View Window Parameters 169 11 3 Drawing a Graph in the Active Screen 170 11 4 Displaying a Graph in the Inactive Screen 171 Chapter 12 Graph to Table 175 12 1 Before Using Graph to Table 176 1...

Page 26: ...Files 248 Chapter 18 Statistical Graphs and Calculations 249 18 1 Before Performing Statistical Calculations 250 18 2 Paired Variable Statistical Calculation Examples 251 18 3 Calculating and Graphing Single Variable Statistical Data 257 18 4 Calculating and Graphing Paired Variable Statistical Data 261 18 5 Performing Statistical Calculations 270 18 6 Tests 276 18 7 Confidence Interval 294 18 8 D...

Page 27: ...Connecting the Unit with a Personal Computer 401 21 3 Connecting the Unit with a CASIO Label Printer 402 21 4 Before Performing a Data Communication Operation 403 21 5 Performing a Data Transfer Operation 404 21 6 Screen Send Function 408 21 7 Data Communications Precautions 409 Chapter 22 Program Library 411 1 Prime Factor Analysis 412 2 Greatest Common Measure 414 3 t Test Value 416 4 Circle and...

Page 28: ...xxvi Contents ...

Page 29: ...u When g is indicated in the function menu for key 6 it means that pressing 6 displays the next page or previous page of menu options uMenu Titles Menu titles in this user s guide include the key operation required to display the menu being explained The key operation for a menu that is displayed by pressing K and then MAT would be shown as OPTN MAT 6 g key operations to change to another menu pag...

Page 30: ...board are color coded to help you find the one you need quickly and easily Function Key Operation 1 log l 2 10x l 3 B al The following describes the color coding used for key markings Color Key Operation Orange Press and then the key to perform the marked function Red Press aand then the key to perform the marked function ...

Page 31: ...an the one you thought you selected The following explains the meaning of each icon Icon Mode Name Description RUN Use this mode for arithmetic calculations and function calculations and for calculations involving binary octal decimal and hexadecimal values STATistics Use this mode to perform single variable standard deviation and paired variable regression statistical calculations to perform test...

Page 32: ... of graphs LINK Use this mode to transfer memory contents or back up data to another unit CONTrast Use this mode to adjust the contrast of the display MEMory Use this mode to check how much memory is used and remaining to delete data from memory and to initialize reset the calculator Icon Mode Name Description 2 Selecting Icons and Entering Modes k Using the Set Up Screen The mode s set up screen ...

Page 33: ...thmetic calculation mode Dec Hex Bin Oct decimal hexadecimal binary octal uFunc Type graph function type Y r Parm X c rectangular coordinate polar coordinate parametric coordinate X constant graph Y Y Y Y y f x y f x y f x y f x inequality graph The v key inputs one of three different variable names Which variable name it inputs is determined by the Func Type setting you make uDraw Type graph draw...

Page 34: ...ation calculation Gaus Simp integration calculation using Gauss Kronrod rule Simpson s rule uStat Wind statistical graph view window setting method Auto Man automatic manual uGraph Func function display during graph drawing and trace On Off display on display off uBackground graph display background None PICT no background graph background picture specification uPlot Line plot and line graph color...

Page 35: ...raphs drawn in area numeric sequence uDynamic Type Dynamic Graph type Cnt Stop non stop continuous automatic stop after 10 draws uLocus Dynamic Graph Locus Mode On Off locus identified by color locus not drawn uVariable Table Generation and Graph Draw settings Rang LIST use table range use list data uΣ Display Σ value display in recursion table On Off display on display off uSlope display of deriv...

Page 36: ...or can display data in three colors orange blue and green The default color for graphs and comment text is blue but you can specify orange or green if you want Orng Grn orange green The above setting affects the color of graphs and comment text Specify the color you want to use before inputting the graph s function or the program comment text k About Menu Item Types This calculator uses certain co...

Page 37: ...d Norm 2 each time you perform the above operation There is no display indicator to show you which exponential display range is currently in effect but you can always check it by seeing what results the following calculation produces Ab caaw Norm 1 Norm 2 All of the examples in this manual show calculation results using Norm 1 uHow to interpret exponential format 1 2E 12 indicates that the result ...

Page 38: ... 12 34 56 78 In addition to the above this calculator also uses other indicators or symbols which are described in each applicable section of this manual as they come up k Calculation Execution Indicator Whenever the calculator is busy drawing a graph or executing a long complex calculation or program a black box k flashes in the upper right corner of the display This black box tells you that the ...

Page 39: ...nd c keys to move the pointer so it is next to the color ORANGE BLUE GREEN whose tint you want to adjust 2 Press the e cursor key to give the color a greener tint and the d cursor key to give it an orange tint Holding down either key changes the setting at high speed uTo initialize color tint settings INIT IN A initialize highlighted color initialize all colors uTo exit the contrast adjustment scr...

Page 40: ...t hang up and stop responding to input from the keyboard press the P button on the back of the calculator to reset the memory Note however that this clears all the data in calculator memory k Low Battery Message The low battery message appears whenever you press o to turn power on or m to display the Main Menu while the main battery power is below a certain level o or m About 3 seconds later If yo...

Page 41: ...Basic Operation 1 1 Before Starting Calculations 1 2 Memory 1 3 Option OPTN Menu 1 4 Variable Data VARS Menu 1 5 Program PRGM Menu 1 Chapter ...

Page 42: ...ans 400 grads 90 π 2 radians 100 grads k k k k k Setting the Display Format Display 1 Display the set up screen and use the f and c keys to highlight Display 2 Press the function key for the item you want to set Fix Sci Norm Eng fixed number of decimal places specification number of significant digits specification exponential format display range toggle Engineering Mode 3 Press J to return to the...

Page 43: ... u To specify the exponential display range Norm 1 Norm 2 Press 3 Norm to switch between Norm 1 and Norm 2 Norm 1 10 2 0 01 x x 1010 Norm 2 10 9 0 000000001 x x 1010 u u u u u To specify the engineering notation display Eng Press 4 Eng to switch between engineering notation and standard notation The indicator E is on the display while engineering notation is in effect The following are the 11 engi...

Page 44: ...integrations Σ calculations d dx d2 dx2 dx Σ Mat Solve FMin FMax List Mat Fill Seq SortA SortD Min Max Median Mean Augment Mat List List 2 Type A functions With these functions the value is entered and then the function key is pressed x2 x 1 x ENG symbols 3 Power root xy x 4 Fractions ab c 5 Abbreviated multiplication format in front of π memory name or variable name 2π 5A X min F Start etc 6 Type...

Page 45: ...re executed from right to left Anything contained within parentheses receives highest priority Example 2 3 log sin2π2 6 8 22 07101691 angle unit Rad k k k k k Multiplication Operations without a Multiplication Sign You can omit the multiplication sign in any of the following operations Example 2sin30 10log1 2 2 2Pol 5 12 etc 3 Before constants variable names memory names Example 2π 2AB 3Ans 3Y1 et...

Page 46: ...outine stack Example Calculations are performed according to the priority sequence Once a calculation is executed it is cleared from the stack Storing a complex number takes up two numeric value stack levels Storing a two byte function takes up two command stack levels k k k k k Input Output and Operation Limitations The allowable range for both input and output values is 10 digits for the mantiss...

Page 47: ... exceeded Mem ERROR When you use a command that requires an argument without providing a valid argument Arg ERROR When an attempt is made to use an illegal dimension during matrix calculations Dim ERROR Other errors can occur during program execution Most of the calculator s keys are inoperative while an error message is displayed You can resume operation using one of the two following procedures ...

Page 48: ...o note that the key operations used to clear each type of display are different u u u u uTo clear the graphic display Press 4 Sketch 1 Cls w u u u u uTo clear the text display Press A k k k k k Editing Calculations Use the d and e keys to move the cursor to the position you want to change and then perform one of the operations described below After you edit the calculation you can execute it by pr...

Page 49: ...change 2 362 to sin2 362 c dgx ddddd s When you press the insert location is indicated by the symbol t The next function or value you input is inserted at the location of t To abort the insert operation without inputting anything move the cursor press again or press d e or w ...

Page 50: ... u u uTo assign a value to a variable value a variable name w Example To assign 123 to variable A AbcdaaAw Example To add 456 to variable A and store the result in variable B AaA efgaaBw u u u u uTo display the contents of a variable Example To display the contents of variable A AaAw u u u u uTo clear a variable Example To clear variable A AaaaAw To clear all variables select Memory Usage from the...

Page 51: ...ction list u u u u uTo store a function Example To store the function A B A B as function memory number 1 K6 g 6 g 3 FMEM A aA aB aA aB 1 STO 1 f1 If the function memory number you assign a function to already contains a function the previous function is replaced with the new one u u u u uTo recall a function Example To recall the contents of function memory number 1 K6 g 6 g 3 FMEM A 2 RCL 1 f1 T...

Page 52: ...ng Example To store x3 1 x2 x into function memory and then graph y x3 x2 x 1 Use the following View Window parameters Xmin 4 Ymin 10 Xmax 4 Ymax 10 Xscale 1 Yscale 1 Zc1 Y JK6 g 6 g 3 FMEM AvMd b1 STO 1 f1 stores x3 1 Avx v1 STO 2 f2 stores x2 x A 4 Sketch 1 Cls w 4 Sketch 5 GRPH 1 Y K6 g 6 g 3 FMEM 3 fn 1 f1 2 f2 w For full details about graphing see 8 Graphing k k k k k Memory Status MEM You ca...

Page 53: ...tions and graphs Matrix Matrix memory data List File List data Y Graph functions Draw Memory Graph drawing conditions View Window enlargement reduction factor graph screen Graph Memory Graph memory data View Window View Window memory data Picture Graph screen data Dynamic Graph Dynamic Graph data Table Function Table Graph data Recursion Recursion Table Graph data Equation Equation calculation dat...

Page 54: ...n step 1 allows deletion of specific data 2 Press 1 DEL 3 Press the function key that corresponds to the data you want to delete The above example shows the function menu that appears when you highlight List File in step 1 4 Press 1 YES If the data type you select in step 1 allows deletion of all data only 2 Press 1 DEL 3 Press 1 YES to delete all of the data 1 2 3 4 5 6 1 2 3 4 5 6 This menu appe...

Page 55: ... distribution calculation menu NUM numeric calculation menu ANGL menu for angle coordinate conversion sexagesimal input conversion ESYM engineering symbol menu PICT graph save recall menu FMEM function memory menu LOGIC logic operator menu Pressing K causes the following function key menu to appear while binary octal decimal or hexadecimal is set as the default number system COLR graph color menu ...

Page 56: ...nu T θ menu u u u u u R X R Y R T θ x axis menu y axis menu T θ menu for right side of Dual Graph The following are the items that appear in the above menus min max scal ptch minimum value maximum value scale pitch k k k k k FACT Recalling enlargement reduction factors Selecting FACT from the VARS menu displays the enlargement reduction factor recall menu Xfct Yfct x axis factor y axis factor k k ...

Page 57: ...he items that appear in the above menu n o o o o o xσn 1 number of data data mean sample standard deviation n1 n2 number of data 1 data 2 o o o o o1 o o o o o2 mean of data 1 data 2 x1σ x2σ sample standard deviation of data 1 data 2 xpσ pooled sample standard deviation F F value ANOVA Fdf SS MS factor degrees of freedom sum of squares mean of squares Edf SSe MSe error degrees of freedom sum of squ...

Page 58: ...Xmax 5 Ymax 5 Xscale 1 Yscale 1 4 Sketch 5 GRPH 1 Y J4 GRPH 1 Y cw k k k k k DYNA Recalling Dynamic Graph Set Up Data Selecting DYNA from the VARS menu displays the Dynamic Graph set up data recall menu Strt End Pitch coefficient range start value coefficient range end value coefficient value increment k k k k k TABL Recalling Table Graph Set Up and Content Data Selecting TABL from the VARS menu d...

Page 59: ... menu The following are the items that appear in the above menu Strt End table range start value table range end value a0 a1 a2 zero term ao value first term a1 value second term a2 value b0 b1 b2 zero term bo value first term b1 value second term b2 value anSt bnSt origin of an bn recursion formula convergence divergence graph WEB graph u u u u u Reslt matrix of table contents Selecting Reslt dis...

Page 60: ...ns coefficients for linear equations with two through six unknowns P Rlt P Cof matrix of solution coefficients for a quadratic or cubic equation Example 1 To recall the solutions for the following linear equations with two unknowns 2x 3y 8 3x 5y 14 1 S Rlt w Example 2 To recall the coefficients for the following linear equations with three unknowns 4x y 2z 1 x 6y 3z 1 5x 4y z 7 2 S Cof w Example 3...

Page 61: ...are no solutions obtained for the equation k k k k k TVM Recalling Financial Calculation Data Selecting TVM from the VARS menu displays the financial calculation data recall menu n I PV PMT FV payment periods installments interest principal payment amount account balance or principal plus interest following the final installment P Y C Y number of installment periods per year number of compounding ...

Page 62: ... menu DISP display command menu REL conditional jump relational operator menu I O input output control command menu multistatement connector The function key menu appears if you press W in the RUN Mode or the PRGM Mode while binary octal decimal or hexadecimal is set as the default number system Prog JUMP REL The functions assigned to the function keys are the same as those in the Comp Mode For de...

Page 63: ...Manual Calculations 2 1 Basic Calculations 2 2 Special Functions 2 3 Function Calculations Chapter 2 ...

Page 64: ... 5 w 4 0 3 4 5 1 2 3 E2 does not produce the correct result Be sure to enter this calculation as shown 2 Final closed parentheses immediately before operation of the w key may be omitted no matter how many are required 3 A multiplication sign immediately before an open parenthesis may be omitted 4 This is identical to 6 4 5 w k k k k k Number of Decimal Places Number of Significant Digits Exponent...

Page 65: ...Norm 2 exponential display for values outside the range of 10 9 to 1010 Example 100 6 16 66666666 Condition Operation Display 100 6w 16 66666667 4 decimal places Zccccccccc 1 Fix 5 4 Jw 16 6667 5 significant digits Zccccccccc 2 Sci 6 g 1 5 Jw 1 6667E 01 Cancels specification Zccccccccc 3 Norm Jw 16 66666667 1 Displayed values are rounded off to the place you specify Example 200 7 14 400 Condition ...

Page 66: ...38 k k k k k Calculations Using Variables Example Operation Display 193 2aaAw 193 2 193 2 23 8 4 aA 23w 8 4 193 2 28 6 9 aA 28w 6 9 2 1 Basic Calculations ...

Page 67: ...its for the mantissa and 2 digits for the exponent Answer memory contents are not cleared when you press the A key or when you switch power off Note that answer memory contents are not changed by an operation that assigns values to value memory such as faaAw k k k k k Performing Continuous Calculations The unit lets you use the result of one calculation as one of the arguments in the next calculat...

Page 68: ... perform another calculation or change modes The contents of the replay memory are not cleared when you press the A key so you can recall a calculation and execute it even after performing the all clear operation Note however that replay memory contents are cleared whenever you change to another mode or menu After you press A you can press f or c to recall previous calculations in sequence from th...

Page 69: ...lculations and in programmed calculations There are two different ways that you can use to connect statements to form multistatements Colon Statements that are connected with colons are executed from left to right without stopping Display Result Command When execution reaches the end of a statement followed by a display result command execution stops and the result up to that point appears on the ...

Page 70: ...t of a multistatement is always displayed regardless of whether it ends with a display result command You cannot construct a multistatement in which one statement directly uses the result of the previous statement Example 123 456 5 Invalid Intermediate result at point where is used 2 2 Special Functions ...

Page 71: ...Calculations PROB OPTN PROB x press after inputting a value to obtain the factorial of the value nPr nCr permutation combination Ran pseudo random number generation 0 to 1 P Q R normal probability P t Q t R t t value of normalized variate t x u u u u uNumeric Calculations NUM OPTN NUM Abs select this item and input a value to obtain the absolute value of the value Int Frac select the item and inpu...

Page 72: ...ilo 103 mega 106 giga 109 tera 1012 peta 1015 exa 1018 ENG ENG shifts the decimal place of the displayed value three digits to the left right and decreases increases the exponent by three When you are using engineering notation the engineering symbol is also changed accordingly The ENG and ENG menu options appear only when there is a calculation result shown on the display k k k k k Angle Units On...

Page 73: ...ion binary octal decimal hexadecimal mode Example Operation Display sin 63 0 8910065242 Zcccc 1 Deg J s63w 0 8910065242 cos π rad 0 5 Zcccc 3 2 Rad J c 7 d w 0 5 tan 35gra 0 6128007881 Zcccc 3 Gra J t 35w 0 6128007881 2 sin 45 cos 65 0 5976724775 Zcccc 1 Deg J 2 s45 c65w 1 0 5976724775 cosec 30 1 2 1 s30w 2 sin30 sin 1 0 5 30 x when sinx 0 5 S0 5 2 w 30 1 can be omitted 2 Input of leading zero is ...

Page 74: ... 81 34 3 3 3 3 81 3M4w 81 1 7 1237 123 1 988647795 7 q123w 1 988647795 2 3 3 4 10 2 3 3 q64 4w 1 10 64 1 xy and x take precedence over multiplication and division k k k k k Hyperbolic and Inverse Hyperbolic Functions Be sure to specify Comp for Calculation binary octal decimal hexadecimal mode Example Operation Display sinh 3 6 18 28545536 K6 g 2 HYP 1 sinh 3 6w 18 28545536 cosh 1 5 sinh 1 5 K6 g ...

Page 75: ...42 49 w 42 36 42 49 Random number generation K6 g 3 PROB pseudo random number 4 Ran w Ex 0 4810497011 between 0 and 1 What is the absolute value of the common logarithm of 3 4 log 3 0 1249387366 K6 g 4 NUM 4 1 Abs l 3 4 w 0 1249387366 What is the integer part of K6 g 4 NUM 3 5 2 Int 3 5w 3 What is the decimal part of K6 g 4 NUM 3 5 3 Frac 3 5w 0 5 What is the nearest integer K6 g 4 NUM not exceedi...

Page 76: ...r and θ when x 14 and y 20 7 Operation Display Zcccc1 Deg J K6 g 5 ANGL 6 g 1 Pol 14 20 7 w Ans 1 24 989 24 98979792 r 2 55 928 55 92839019 θ Example To calculate x and y when r 25 and θ 56 Operation Display Zcccc1 Deg J K6 g 5 ANGL 6 g 2 Rec 25 56 w Ans 1 13 979 13 97982259 x 2 20 725 20 72593931 y k k k k k Permutation and Combination u u u u u Permutation u u u u u Combination Be sure to specif...

Page 77: ...cimal mode Example Operation Display 2 5 3 1 4w 3 13 20 Conversion to decimal 1 M 3 65 1 2578 1 4572w 6 066202547E 04 2 Norm 1 display format 1 2 5w 0 25 3 1 1 3 1 4 w 4 1 5 7 1 Fractions can be converted to decimal values and vice versa 2 When the total number of characters including integer numerator denominator and delimiter marks exceeds 10 the input fraction is converted to decimal format 3 C...

Page 78: ...kilo 999K 1 024M mega 6 g 6 g 1 ESYM 6 g 1 k 251 k w 1 024M 9 10 0 9 900m milli 9 10w 900 m K6 g 6 g 1 ESYM 6 g 6 g 3 ENG 1 0 9 3 ENG 1 0 0009k 2 ENG 2 0 9 2 ENG 2 900 m 1 Converts the displayed value to the next higher engineering unit by shifting the decimal point three places to the right 2 Converts the displayed value to the next lower engineering unit by shifting the decimal point three place...

Page 79: ... octal decimal hexadecimal mode Example What is the logical AND of A and B when A 3 and B 2 A AND B 1 Operation Display 3aaAw 2aaBw aAK6 g 6 g 4 LOGIC 1 And aBw 1 Example What is the logical OR of A and B when A 5 and B 1 A OR B 1 Operation Display 5aaAw 1aaBw aAK6 g 6 g 4 LOGIC 2 Or aBw 1 Example Negate A when A 10 NOT A 0 Operation Display 10aaAw K6 g 6 g 4 LOGIC 3 Not aAw 0 Function Calculation...

Page 80: ...The following table shows all of possible results that can be produced by AND and OR operations Value or Expression A Value or Expression B A AND B A OR B A G 0 B G 0 1 1 A G 0 B 0 0 1 A 0 B G 0 0 1 A 0 B 0 0 0 The following table shows the results produced by the NOT operation Value or Expression A NOT A A G 0 0 A 0 1 ...

Page 81: ...tions 3 1 Before Performing a Calculation 3 2 Differential Calculations 3 3 Quadratic Differential Calculations 3 4 Integration Calculations 3 5 Maximum Minimum Value Calculations 3 6 Summation Σ Calculations Chapter 3 ...

Page 82: ...ns FMin FMax Σ minimum value maximum value Σ sigma calculations Solve calculations The following is the syntax for using the Solve function in a program Solve f x n a b Upper limit Lower limit Initial estimated value There are two different input methods that can be used for Solve calcula tions direct assignment and variable table input With the direct assignment method the one described here you ...

Page 83: ...s unit employs central difference to perform differential calculations The following illustrates central difference A A A A A A A The slopes of point a and point a Ax and of point a and point a Ax in function y f x are as follows In the above Ay Ax is called the forward difference while y x is the backward difference To calculate derivatives the unit takes the average between the value of Ay Ax an...

Page 84: ...ase of x bE f w In the function f x only X can be used as a variable in expressions Other variables A through Z r θ are treated as constants and the value currently assigned to that variable is applied during the calculation Input of Ax and the closing parenthesis can be omitted If you omit Ax the calculator automatically uses a value for Ax that is appropriate for the deriva tive value you are tr...

Page 85: ...x a Ax of a differential Note that you cannot use a Solve differential quadratic differential integration maximum minimum value or Σ calculation expression inside a differential calculation term Pressing A during calculation of a differential while the cursor is not shown on the display interrupts the calculation Always use radians Rad Mode as the angle unit when performing trigono metric differen...

Page 86: ...tion is finished when the value of f x based on the value of h calculated using the last value of m and the value of f x based on the value of h calculated using the current value of m are identical before the upper n digit is reached Normally you should not input a value for n It is recommended that you only input a value for n when required for calculation precision Inputting a larger value for ...

Page 87: ...f a g a f a g a etc The result of a quadratic differential calculation can be used in a subsequent arithmetic or function calculation 2 f a log f a etc Functions can be used within the terms f x a n of a quadratic differential expression Note that you cannot use a Solve differential quadratic differential integration maximum minimum value or Σ calculation expression inside of a quadratic different...

Page 88: ...lates the surface area of the shaded area in the illustration When f x 0 on a x b the surface area calculation produces negative values surface area below the x axis k Changing Integration Calculation Methods This calculator can use either Gauss Kronrod Rule or Simpson s Rule to perform integration calculations To select a method display the set up screen and select either Gaus for Gauss Kronrod R...

Page 89: ... you omit tol the calculator automatically uses a value of 1E 5 In the case of n the calculator automati cally selects the most appropriate value Integration calculations can take a long time to complete k k k k k Application of Integration Calculation Integrals can be used in addition subtraction multiplication or division a b f x dx c d g x dx etc Integration results can be used in addition subt...

Page 90: ... to ensure correct integration values 1 When cyclical functions for integration values become positive or negative for different divisions perform the calculation for single cycles or divide between negative and positive and then add the results together a b f x dx a c f x dx c b f x dx Positive part S Negative part S 2 When minute fluctuations in integration divisions produce large fluctuations i...

Page 91: ... a b n u u u u uMaximum Value 6 g 2 FMax f x a b n u u u u uTo perform maximum minimum value calculations Example 1 To determine the minimum value for the interval defined by start point a 0 and end point b 3 with a precision of n 6 for the function y x2 4x 9 Input f x AK4 CALC 6 g 1 FMin vx ev j Input the interval a 0 b 3 a d Input the precision n 6 g w Precision n 1 to 9 End point of interval St...

Page 92: ...drastic fluctuation can adversely affect precision or even cause an error Note that you cannot use a Solve differential quadratic differential integration maximum minimum value or Σ calculation expression inside of a maximum minimum calculation term Inputting a larger value for n increases the precision of the calculation but it also increases the amount of time required to perform the calculation...

Page 93: ... ak using the following formula k k k k k Example Σ Calculation Example To calculate the following Use n 1 as the distance between partitions Input sequence ak AK4 CALC 6 g 3 Σ aKx daK f Input variable used by sequence ak aK Input the initial term of sequence ak and last term of sequence ak c g Input n b w Distance between partitions Last term of sequence ak Initial term of sequence ak Variable us...

Page 94: ...le operations Sn Tn Sn Tn etc Arithmetic and function operations using Σ calculation results 2 Sn log Sn etc Function operations using Σ calculation terms ak k Σ sink k 1 5 etc Note that you cannot use a Solve differential quadratic differential integration maximum minimum value or Σ calculation expression inside of a Σ calculation term Make sure that the value used as the final term β is greater ...

Page 95: ...tion division Calculation of the reciprocal square root and square of a complex number Calculation of the absolute value and argument of a complex number Calculation of conjugate complex numbers Extraction of the real part Extraction of the imaginary part 4 1 Before Beginning a Complex Number Calculation 4 2 Performing Complex Number Calculations Chapter 4 ...

Page 96: ...alculation Before beginning a complex number calculation press K3 CPLX to display the complex number calculation menu i imaginary unit i input Abs Arg obtains absolute value argument Conj obtains conjugate ReP ImP real imaginary part extraction ...

Page 97: ... and memory Example 1 1 2i 2 3i AK3 CPLX b c1 i c d1 i w Example 2 2 i 2 i AK3 CPLX c 1 i c 1 i w k k k k k Reciprocals Square Roots and Squares Example 3 i AK3 CPLX 9 d 1 i w k k k k k Absolute Value and Argument OPTN CPLX Abs Arg The unit regards a complex number in the form a bi as a coordinate on a Gaussian plane and calculates absolute value Z and argument arg Example To calculate absolute va...

Page 98: ...omplex number of the form a bi Example To calculate the conjugate complex number for the complex number 2 4i AK3 CPLX 4 Conj c e1 i w k k k k k Extraction of Real and Imaginary Parts OPTN CPLX ReP lmP Use the following procedure to extract the real part a and the imaginary part b from a complex number of the form a bi Example To extract the real and imaginary parts of the complex number 2 5i AK3 C...

Page 99: ... exponent When a complex number has more than 21 digits the real part and imaginary part are displayed on separate lines When either the real part or imaginary part equals zero that part is not displayed 20 bytes of memory are used whenever you assign a complex number to a variable The following functions can be used with complex numbers x2 x 1 Int Frac Rnd Intg Fix Sci ENG ENG a b c d c F D P 22 ...

Page 100: ...72 ...

Page 101: ...ons involving different number systems Number system conversion Arithmetic operations Negative values Bitwise operations 5 1 Before Beginning a Binary Octal Decimal or Hexadecimal Calculation with Integers 5 2 Selecting a Number System 5 3 Arithmetic Operations 5 4 Negative Values and Bitwise Operations Chapter 5 ...

Page 102: ...he decimal part If you attempt to enter a value that is invalid for the number system binary octal decimal hexadecimal you are using the calculator displays an error message The following shows the numerals that can be used in each number system Binary 0 1 Octal 0 1 2 3 4 5 6 7 Decimal 0 1 2 3 4 5 6 7 8 9 Hexadecimal 0 1 2 3 4 5 6 7 8 9 A B C D E F The alphabetic characters used in the hexadecimal...

Page 103: ...lues Positive 0 x 7FFFFFFF Negative 80000000 x FFFFFFFF u u u u uTo perform a binary octal decimal or hexadecimal calculation 1 In the main menu select RUN 2 Press Z and then specify the defalut number system by pressing 2 Dec 3 Hex 4 Bin or 5 Oct 3 Press J to change to the screen for calculation input This causes a function menu with the following items to appear d o LOG number system specificati...

Page 104: ... d ccw Z4 Bin Jw Z5 Oct Jw u u u u uTo specify a number system for an input value You can specify a number system for each individual value you input While binary octal decimal or hexadecimal is set as the default number system press 1 d o to display a menu of number system symbols Press the function key that corresponds to the symbol you want to select and then input the value you want d h b o de...

Page 105: ... Operations Example 1 To calculate 101112 110102 Z4 Bin J Ababbb bbabaw Example 2 To input and execute 1238 ABC16 when the default number system is decimal or hexadecimal Z2 Dec J A1 d o 4 o bcd 2 h ABCw Z3 Hex Jw P 74 ...

Page 106: ...alues Example To determine the negative of 1100102 Z4 Bin J A2 LOG 1 Neg bbaabaw k k k k k Bitwise Operations Example 1 To input and execute 12016 and AD16 Z3 Hex J Abca2 LOG 3 and ADw Example 2 To display the result of 368 or 11102 as an octal value Z5 Oct JJ Adg2 LOG 4 or J1 d o 3 b bbbaw Example 3 To negate 2FFFED16 Z3 Hex JJ A2 LOG 2 Not cFFFEDw 1 two s complement 2 one s complement bitwise co...

Page 107: ...calculations Determinant calculations Matrix transposition Matrix inversion Matrix squaring Raising a matrix to a specific power Absolute value integer part extraction fractional part extraction maximum integer calculations Matrix modification using matrix commands 6 1 Before Performing Matrix Calculations 6 2 Matrix Cell Operations 6 3 Modifying Matrices Using Matrix Commands 6 4 Matrix Calculati...

Page 108: ...Matrix Answer Memory Note the following points about Matrix Answer Memory Whenever you perform a matrix calculation the current Matrix Answer Memory contents are replaced by the new result The previous contents are deleted and cannot be recovered Inputting values into a matrix does not affect Matrix Answer Memory contents k k k k k Creating a Matrix To create a matrix you must first define its dim...

Page 109: ...move to the next cell to the right Displayed cell values show positive integers up to six digits and negative integers up to five digits one digit used for the negative sign Exponential values are shown with up to two digits for the exponent Fractional values are not displayed You can see the entire value assigned to a cell by using the cursor keys to move the highlighting to the cell whose value ...

Page 110: ...L 3 Press 1 YES to delete the matrix or 6 NO to abort the operation without deleting anything The indicator None replaces the dimensions of the matrix you delete u u u u uTo delete all matrices 1 While the MATRIX list is on the display press 2 DEL A 2 Press 1 YES to delete all matrices in memory or 6 NO to abort the operation without deleting anything The indicator None is shown for all the matric...

Page 111: ...All of the following examples use Matrix A recalled by the above operation k k k k k Row Calculations The following menu appears whenever you press 1 R OP while a recalled matrix is on the display Swap row swap Rw product of specified row and scalar Rw addition of one row and the product of a specified row with a scalar Rw addition of specified row to another row u u u u uTo swap two rows Example ...

Page 112: ...alculate the product of row 2 of the following matrix and the scalar 4 then add the result to row 3 1 2 Matrix A 3 4 5 6 1 R OP 3 Rw Input multiplier value ew Specify the row number whose product should be calculated cw Specify the row number where result should be added dw u u u u uTo add two rows together Example To add row 2 to row 3 of the following matrix 1 2 Matrix A 3 4 5 6 1 R OP 4 Rw Spec...

Page 113: ...isplay DEL delete row INS insert row ADD add row u u u u uTo delete a row Example To delete row 2 of the following matrix 1 2 Matrix A 3 4 5 6 2 ROW c 1 DEL u u u u uTo insert a row Example To insert a new row between rows 1 and 2 of the following matrix 1 2 Matrix A 3 4 5 6 2 ROW c 2 INS Matrix Cell Operations 6 2 ...

Page 114: ... ADD k k k k k Column Operations The following menu appears whenever you press 3 COL while a recalled matrix is on the display DEL delete column INS insert column ADD add column u u u u uTo delete a column Example To delete column 2 of the following matrix 1 2 Matrix A 3 4 5 6 3 COL e 1 DEL 6 2 Matrix Cell Operations ...

Page 115: ...w column between columns 1 and 2 of the following matrix 1 2 Matrix A 3 4 5 6 3 COL e 2 INS u u u u uTo add a column Example To add a new column to the right of column 2 of the following matrix 1 2 Matrix A 3 4 5 6 3 COL e 3 ADD Matrix Cell Operations 6 2 ...

Page 116: ...ommand assign contents of selected column to list file Aug Augment command link two matrices Iden Identity command identity matrix input Dim Dim command dimension check Fill Fill command identical cell values k k k k k Matrix Data Input Format The following shows the format you should use when inputting data to create a matrix using the matrix operation menu s Mat command a11 a12 a1n a21 a22 a2n a...

Page 117: ...s u u u u uTo check the dimensions of a matrix Use the matrix operation menu s Dim command 2 to check the dimensions of an existing matrix Example 3 To check the dimensions of Matrix A which was input in Example 1 K2 MAT 6 g 2 Dim 6 g 1 Mat aAw The display shows that Matrix A consists of two rows and three columns You can also use Dim to specify the dimensions of the matrix Example 4 To specify di...

Page 118: ...ix name A through Z or Ans m row number n column number Example 1 Assign 10 to the cell at row 1 column 2 of the following matrix 1 2 Matrix A 3 4 5 6 baaK2 MAT 1 Mat aA b c w Example 2 Multiply the value in the cell at row 2 column 2 of the above matrix by 5 K2 MAT 1 Mat aA c c fw u u u u uTo fill a matrix with identical values and to combine two matrices into a single matrix Use the matrix opera...

Page 119: ...List Mat X m List n X matrix name A through Z or Ans m column number n list number Example To assign the contents of column 2 of the following matrix to list file 1 1 2 Matrix A 3 4 5 6 K2 MAT 2 M L 1 Mat aA c a Column number K1 LIST 1 List bw You can use Matrix Answer Memory to assign the results of the above matrix input and edit operations to a matrix variable To do so use the following syntax ...

Page 120: ...c operations Mat Mat command matrix specification Det Det command determinant command Trn Trn command transpose matrix command Iden Identity command identity matrix input All of the following examples assume that matrix data is already stored in memory k k k k k Matrix Arithmetic Operations Matrix 1 Arithmetic operator key Matrix 2 Mat A Mat A w Mat Z Mat Z MatAns MatAns Example 1 To add the follo...

Page 121: ...mand menu s Identity command 1 to input the identity matrix Example 3 To multiply Matrix A from Example 1 by a 2 2 identity matrix 1 Mat aA 6 g 1 Iden cw Number of rows and columns k k k k k Matrix Scalar Multiplication The following is the format for calculating a matrix scalar multiplication which multiplies the value in each cell of the matrix by the same value Scalar value Matrix Mat A k w Mat...

Page 122: ...ated as shown below A a11 a12 a11a22 a12a21 a21 a22 The determinant of a 3 3 matrix is calculated as shown below a11 a12 a13 A a21 a22 a23 a31 a32 a33 a11a22a33 a12a23a31 a13a21a32 a11a23a32 a12a21a33 a13a22a31 k k k k k Matrix Transposition A matrix is transposed when its rows become columns and its columns become rows The following is the format for matrix transposition Matrix Mat A 4 Trn w Mat ...

Page 123: ... produces an error A matrix with a value of zero cannot be inverted Trying to invert a matrix with value of zero produces an error Calculation precision is affected for matrices whose value is near zero A matrix being inverted must satisfy the conditions shown below A A 1 A 1 A E 1 0 0 1 The following shows the formula used to invert Matrix A into inverse matrix A 1 A a b c d A 1 1 d b ad bc c a N...

Page 124: ...ing a Matrix to a Power Matrix Natural number Mat A M k w Mat Z MatAns Example To raise the following matrix to the third power Matrix A 1 2 3 4 1 Mat aAMdw k k k k k Determining the Absolute Value Integer Part Fraction Part and Maximum Integer of a Matrix Function command Matrix Abs Mat A Frac w Int Mat Z Intg MatAns 6 4 Matrix Calculations ...

Page 125: ...siderable time to complete The calculation precision of displayed results for matrix calculations is 1 at the least significant digit If a matrix calculation result is too large to fit into Matrix Answer Memory an error occurs You can use the following operation to transfer Matrix Answer Memory contents to another matrix or when Matrix Answer Memory contains a determinant to a variable MatAns Mat ...

Page 126: ...98 ...

Page 127: ...ions Linear equations with two to six unknowns High order equations quadratic cubic Solve calculations 7 1 Before Beginning an Equation Calculation 7 2 Linear Equations with Two to Six Unknowns 7 3 Quadratic and Cubic Equations 7 4 Solve Calculations 7 5 What to Do When an Error Occurs Chapter 7 ...

Page 128: ...s POLY quadratic or cubic equation SOLV solve calculation k k k k k Clearing Equation Memories 1 Enter the equation calculation mode SIML or POLY you want to use and perform the function key operation required for that mode In the case of the SIML Mode 1 use function keys 1 2 through 5 6 to specify the number of unknowns In the case of the POLY Mode 2 use function keys 1 2 or 2 3 to specify the de...

Page 129: ... g1 a2x b2y c2z d2t e2u f2v g2 a3x b3y c3z d3t e3u f3v g3 a4x b4y c4z d4t e4u f4v g4 a5x b5y c5z d5t e5u f5v g5 a6x b6y c6z d6t e6u f6v g6 You can also solve linear equations with three four and five unknowns In each case the format is similar to those shown above k k k k k Specifying the Number of Unknowns While in the Equation Mode press 1 SIML and then specify the number of unknowns 2 3 4 5 6 l...

Page 130: ...wbw cw bw bwgwdwbw fwewbw hw Each time you press w the input value is registered in the highlighted cell Each press of w inputs values in the following sequence coefficient a1 coefficient b1 coefficient c1 coefficient d1 coefficient an coefficient bn coefficient cn coefficient dn n 2 to 6 You can input fractions and value memory contents as coefficients 3 After inputting the coefficients solve the...

Page 131: ...n the coefficients that you use it may take considerable time for the calculation result of simultaneous linear equations to appear on the display Failure of a result to appear immediately does not mean that the unit is not functioning properly k k k k k Changing Coefficients You can change a coefficient either before or after you register it by pressing w u u u u uTo change a coefficient before r...

Page 132: ...atic or Cubic Equation Example To solve the following cubic equation x3 2x2 x 2 0 1 Press 2 3 to enter the Cubic Equation Mode 2 Input each coefficient bw cw bwcw Each time you press w the input value is registered in the highlighted cell Each press of w inputs values in the following sequence coefficient a coefficient b coefficient c coefficient d Input for coefficient d is required only for cubi...

Page 133: ...e root solutions and imaginary number solutions are handled u u u u uTo solve a cubic equation that produces a multiple value solution Example To solve the following cubic equation x3 4x2 5x 2 0 bw ewfw cw 1 SOLV u u u u uTo solve a cubic equation that produces an imaginary number solution Example To solve the following cubic equation x3 x2 x 3 0 bwbwbw dw 1 SOLV It may take considerable time for ...

Page 134: ... then input another one u u u u uTo change a coefficient after registering it with w Use the cursor keys to highlight the cell that contains the coefficient that you want to change Next input the value that you want to change to k k k k k Clearing All the Coefficients While in the Quadratic or Cubic Equation Mode press the 3 CLR function key This operation clears all the coefficients to zero 7 3 Q...

Page 135: ...appears Input the expression You can input numbers alpha characters and operation symbols If you do not input an equals sign the calculator assumes that the expression is to the left of the equals sign and there is a zero to the right To specify a value other than zero to the right of the equals sign you must input the equals sign and the value u u u u uTo perform solve calculations Example To cal...

Page 136: ...s based on the assumption that f x can be approximated by a linear expression within a very narrow range First a starting value predicted value xo is given Using this starting value as a base approximate value x1 is obtained and then the left side and right side calculation results are compared Next approximate value x1 is used as the initial value to calculate the next approximate value x2 This p...

Page 137: ...o be in the vicinity of the solution and perform the calculation again The calculator may be unable to obtain a solution even though a solution exists Due to certain characteristics of Newton s method solutions for the following types of functions tend to be difficult to calculate Periodic functions i e y sinx a Functions whose graph produce sharp slopes i e y ex y 1 x Inverse proportion expressio...

Page 138: ...clear the error and return to the value that was registered for the coefficient before you input the value that generated the error Try inputting a new value again u u u u uError during calculation Press the A key to clear the error and display coefficient a Try inputting values for the coefficients again ...

Page 139: ... Y graphs Polar coordinate r graphs Parametric graphs X constant graphs Inequality graphs Integration graphs in the RUN mode only A selection of graph commands also makes it possible to incor porate graphing into programs 8 1 Before Trying to Draw a Graph 8 2 View Window V Window Settings 8 3 Graph Function Operations 8 4 Graph Memory 8 5 Drawing Graphs Manually 8 6 Other Graphing Functions 8 7 Pi...

Page 140: ...RAPH Mode When you do the Graph Function menu appears on the display You can use this menu to store edit and recall functions and to draw their graphs SEL draw non draw status DEL function delete TYPE graph type menu COLR graph color GMEM graph memory save recall DRAW graph draw Memory area Use f and c to change selection CFX ...

Page 141: ... Window initial settings initial settings using specified angle unit standardized settings STO RCL View Window setting store recall The nearby illustration shows the meaning of each of these parameters 2 Input a value for a parameter and press w The calculator automatically selects the next parameter for input You can also select a parameter using the c and f keys There are actually nine View Wind...

Page 142: ...max value causes the axis to be inverted You can input expressions such as 2π as View Window parameters When the View Window setting does not allow display of the axes the scale for the y axis is indicated on either the left or right edge of the display while that for the x axis is indicated on either the top or bottom edge When View Window values are changed the graph display is cleared and the n...

Page 143: ...zation Press 3 V Window 2 TRIG to initialize the View Window to the following settings Deg Mode Xmin 540 Ymin 1 6 Xmax 540 Ymax 1 6 Xscale 90 Yscale 0 5 Rad Mode Xmin 9 4247779 Xmax 9 42477796 Xscale 1 57079632 Gra Mode Xmin 600 Xmax 600 Xscale 100 The settings for Y min Y max Y pitch T θ min T θ max and T θ pitch remain unchanged when you press 2 TRIG u u u u uTo standardize the View Window Press...

Page 144: ...ories numbered V W1 to V W6 Storing View Window settings in a memory area that already contains settings replaces the existing settings with the new ones u u u u uTo recall View Window settings Pressing 5 RCL 1 V W1 recalls the contents of View Window memory V W1 Recalling View Window settings causes the settings currently on the display to be deleted You can change View Window settings in a progr...

Page 145: ...e graph type you want to specify k k k k k Storing Graph Functions u u u u uTo store a rectangular coordinate function Y Example To store the following expression in memory area Y1 y 2 x2 5 3 TYPE 1 Y Specifies rectangular coordinate expression cvx f Inputs expression w Stores expression You will not be able to store the expression in an area that already contains a parametric function Select anot...

Page 146: ...ant expression or inequality Select another area to store your expression or delete the existing expression first u u u u uTo store an X constant expression Example To store the following expression in memory area X4 X 3 3 TYPE 4 X c Specifies X constant expression d Inputs expression w Stores expression Inputting X Y T r or θ for the constant in the above procedures causes an error u u u u uTo st...

Page 147: ...thout deleting anything Parametric functions come in pairs Xt and Yt When editing a parametric function clear the graph functions and re input from the beginning k k k k k Drawing a Graph u u u u uTo specify the graph color The default color for graph drawing is blue but you can change the color to orange or green if you want 1 While the Graph Function Menu is on the display press f or c to displa...

Page 148: ...e the following View Window parameters Xmin 5 Ymin 5 Xmax 5 Ymax 5 Xscale 1 Yscale 1 cc Select a memory area that contains a function for which you want to specify non draw 1 SEL Specify non draw cc1 SEL c1 SEL 6 DRAW or w Draws the graphs Pressing 6 G T or A returns to the Graph Function Menu 8 3 Graph Function Operations Unhighlights ...

Page 149: ...polar coordinate r or parametric graph will appear coarse if the settings you make in the View Window cause the T θ pitch value to be too large relative to the differential between the T θ min and T θ max settings If the settings you make cause the T θ pitch value to be too small relative to the differential between the T θ min and T θ max settings on the other hand the graph will take a very long...

Page 150: ...To store graph functions in graph memory Pressing 5 GMEM 1 STO 1 GM1 stores the selected graph function into graph memory GM1 There are six graph memories numbered GM1 to GM6 Storing a function in a memory area that already contains a function replaces the existing function with the new one If the data exceeds the calculator s remaining memory capacity an error occurs u u u u uTo recall a graph fu...

Page 151: ...rdinates Y Sketch GRPH Y You can graph functions that can be expressed in the format y f x Example To graph y 2x2 3x 4 Use the following View Window parameters Xmin 5 Ymin 10 Xmax 5 Ymax 10 Xscale 2 Yscale 5 1 In the set up screen specify Y for Func Type and then press J 2 Input the rectangular coordinate Y expression 4 Sketch 1 Cls w 5 GRPH 1 Y cvx dv e 3 Press w to draw the graph You can draw gr...

Page 152: ... 1 In the set up screen specify r for Func Type 2 Specify Rad as the angle unit and then press J 3 Input the polar coordinate expression r 4 Sketch 1 Cls w 5 GRPH 2 r csdv 4 Press w to draw the graph You can draw graphs of the following built in scientific functions sin θ cos θ tan θ sin 1 θ cos 1 θ tan 1 θ sinh θ cosh θ tanh θ sinh 1 θ cosh 1 θ tanh 1 θ θ θ2 log θ lnθ 10θ eθ θ 1 3 θ View Window s...

Page 153: ...e 5 T θ pitch π 36 1 In the set up screen specify Parm for Func Type 2 Specify Rad radians as the angle unit and then press J 3 Input the parametric functions 4 Sketch 1 Cls w 5 GRPH 3 Parm hcv ccd fv hsv csd fv 4 Press w to draw the graph u u u u uTo graph X constant Sketch GRPH X c You can graph functions that can be expressed in the format X constant Example To graph X 3 Use the following View ...

Page 154: ... expressed in the following four formats y f x y f x y f x y f x Example To graph the inequality y x2 2x 6 Use the following View Window parameters Xmin 6 Ymin 10 Xmax 6 Ymax 10 Xscale 1 Yscale 5 1 In the set up screen specify Y for Func Type and then press J 2 Input the inequality 4 Sketch 1 Cls w 5 GRPH 6 g 1 Y vx cv g 3 Press w to draw the graph 8 5 Drawing Graphs Manually ...

Page 155: ...indow parameters Xmin 4 Ymin 8 Xmax 4 Ymax 12 Xscale 1 Yscale 5 1 In the set up screen specify Y for Func Type and then press J 2 Input the integration graph expression 4 Sketch 1 Cls w 5 GRPH 5 G dx v c v b v d c b bE e 3 Press w to draw the graph Before drawing an integration graph be sure to always press 4 Sketch 1 Cls to clear the screen You can also incorporate an integration graph command in...

Page 156: ...d and connected by lines to create a curve Plot Points are plotted without being connected k k k k k Trace With trace you can move a flashing pointer along a graph with the cursor keys and obtain readouts of coordinates at each point The following shows the different types of coordinate readouts produced by trace Rectangular Coordinate Graph Polar Coordinate Graph Parametric Function Graph X Const...

Page 157: ... down either key moves the pointer at high speed 3 Use f and c to move the pointer between the two graphs 4 Use e to move the pointer to the other intersection e e To abort a trace operation press 1 Trace Do not press the A key while performing a trace operation u u u u uTo display the derivative If the Derivative item in the set up screen is set to On the derivative appears on the display along w...

Page 158: ...raphs while tracing You cannot scroll polar coordinate graphs parametric function graphs or X constant graphs The graph on the screen does not scroll when you are tracing while the Dual Screen Mode is set to Graph or G to T Trace can be used only immediately after a graph is drawn It cannot be used after changing the settings of a graph The x and y coordinate values at the bottom of the screen are...

Page 159: ...pecify a range for rectangular coordinate polar coordinate paramet ric and inequality graphs k k k k k Overwrite Using the following syntax to input a graph causes multiple versions of the graph to be drawn using the specified values All versions of the graph appear on the display at the same time function with one variable variable name value value value w Example To graph y Ax2 3 substituting 3 ...

Page 160: ...ge and reduce a graph on the display u u u u uBefore using zoom Immediately after drawing a graph press 2 Zoom to display the Zoom Menu BOX graph enlargement using box zoom FACT displays screen for specification of zoom factors IN OUT enlarges reduces graph using zoom factors AUTO automatically sizes the graph so it fills the screen along the y axis ORIG original size SQR adjusts ranges so x range...

Page 161: ... the function press 2 Zoom 2 Press 1 BOX and then use the cursor keys to move the pointer to the location of one of the corners of the box you want to draw on the screen Press w to specify the location of the corner 3 Use the cursor keys to move the pointer to the location of the corner that is diagonally across from the first corner 4 Press w to specify the location of the second corner When you ...

Page 162: ... move the pointer around the display Example Graph the two functions below and enlarge them five times in order to determine whether or not they are tangential Y1 x 4 x 1 x 3 Y2 3x 22 Use the following View Window parameters Xmin 8 Ymin 30 Xmax 8 Ymax 30 Xscale 5 Yscale 10 1 After graphing the functions press 2 Zoom and the pointer appears on the screen 2 Use the cursor keys to move the pointer to...

Page 163: ...the graph u u u u uTo initialize the zoom factor Press 2 Zoom 2 FACT 1 INIT to initialize the zoom factor to the following settings Xfact 2 Yfact 2 You can use the following syntax to incorporate a factor zoom operation into a program Factor X factor Y factor You can specify only positive value up to 14 digits long for the zoom factors You can use factor zoom for any type of graph k k k k k Auto V...

Page 164: ...6 g 2 Press 2 SQR to make the graph a circle k k k k k Coordinate Rounding Function Zoom RND This feature rounds the coordinate values at the pointer location to the optimum number of significant digits Rounding coordinates is useful when using trace and plot Example To round the coordinates at the points of intersection of the two graphs drawn on page 128 Use the same View Window parameters as in...

Page 165: ...unded coordinate values for the pointer position appear on the screen k k k k k Integer Function Zoom INTG This function makes the dot width equal 1 converts axis values to integers and redraws the graph If one x axis dot is Ax and one y axis dot is Ay Ax Xmax Xmin Ay Ymax Ymin 126 62 Other Graphing Functions 8 6 ...

Page 166: ...any of these functions is used in a statement that ends with a display result command to draw a graph these functions affect the graph up to the display result command only Any graphs drawn after the display result command are drawn according to normal graph overwrite rules k k k k k Returning the View Window to Its Previous Settings Zoom PRE The following operation returns View Window parameters ...

Page 167: ...c1 stores the graph drawn on the display in picture memory Pic1 There are six picture memories numbered Pic1 to Pic6 Storing a graph in a memory area that already contains data replaces the existing data with the new data u u u u uTo recall a stored graph In the GRAPH Mode pressing K1 PICT 2 RCL 1 Pic1 recalls the contents of picture memory Pic1 Dual Graph screens or any other type of graph that u...

Page 168: ...een You can use a background in the RUN STAT GRAPH DYNA TABLE RECUR CONICS Modes Example 1 With the circle graph X2 Y2 1 as the background use Dynamic Graph to graph Y X2 A as variable A changes value from 1 to 1 in increments of 1 Recall the background graph X2 Y2 1 Draw the dynamic graph Y X2 1 Y X2 Y X2 1 See 14 Conic Section Graphs for details on drawing a circle graph and 13 Dynamic Graph for...

Page 169: ... With a statistical histogram as the background graph a normal distribution Recall the backgound graph Histogram Graph the normal distribution See 18 Statistical Graphs and Calculations for details on drawing a statistical graphs P 249 ...

Page 170: ...142 ...

Page 171: ...mination of the local maximum value and local minimum value Determination of the y intercept Determination of the intersection of two graphs Determination of the coordinates at any point y for a given x x for a given y Determination of the integral for any range 9 1 Before Using Graph Solve 9 2 Analyzing a Function Graph Chapter 9 ...

Page 172: ...lv to display a function menu that contains the following items ROOT MAX MIN Y ICPT ISCT root local maximum value local minimum value y intercept intersections of two graphs Y CAL X CAL dx y coordinate for a given x coordinate x coordinate for a given y coordinate integral for a given range ...

Page 173: ... B Xmin 6 3 Ymin 3 1 Xmax 5 Ymax 5 Xmax 6 3 Ymax 3 1 Xscale 1 Yscale 1 Xscale 1 Yscale 1 k k k k k Determining Roots Example To determine the roots for y x x 2 x 2 View Window B 5 G Solv 1 ROOT This puts the unit into standby waiting for selection of a graph A k cursor appears on the graph that has the lowest memory area number Specify the graph you want to use c Use f and c to move the cursor to ...

Page 174: ...ot required Note that the above operation can be performed on rectangular coordinate Y and inequality graphs only k k k k k Determining Local Maximum Values and Local Minimum Values Example To determine the local maximum value and local minimum value for y x x 2 x 2 View Window A 5 G Solv 2 MAX This puts the unit into standby waiting for selection of a graph Specify the graph and determine the loc...

Page 175: ...ular coordinate Y and inequality graphs only k k k k k Determining y intercepts Example To determine the y intercept for y x 1 View Window B 5 G Solv 4 Y ICPT This puts the unit into standby waiting for selection of a graph Determine the y intercept w y intercepts are the points where the graph intersects the y axis If there is only one graph pressing 4 Y ICPT directly displays the y intercepts se...

Page 176: ...fy the second graph Graph Y3 here to determine the points of intersection cw Use f and c to move k on the second graph Intersections are found starting from the left e The next intersection to the right is found If there is no intersection to the right nothing happens when you perform this operation You can use d to move back to the left If there are only two graphs pressing 5 ISCT directly displa...

Page 177: ...Solv 6 g 1 Y CAL Specify a graph cw At this time the unit waits for input of an x coordinate value Input the x coordinate value a f Determine the corresponding y coordinate value w Specify a graph 5 G Solv 6 g 2 X CAL cw At this time the unit waits for input of a y coordinate value Input the y coordinate value d c Determine the corresponding x coordinate value w Analyzing a Function Graph 9 2 ...

Page 178: ... Graph Inequality Graph Note that you can not determine a y coordinate for a given x coordinate with a parametric graph If there is only one graph pressing 1 Y CAL 2 X CAL directly displays the x coordinate y coordinate selection of the graph is not required k k k k k Determining the Integral for Any Range Example 1 5 0 x x 2 x 2 dx View Window A 5 G Solv 6 g 3 dx Graph selection standby Select gr...

Page 179: ...tions Depending on the View Window parameter settings there may be some error in solutions produced by Graph Solve If no solution can be found for any of the above operations the message Not Found appears on the display The following conditions can interfere with calculation precision and may make it impossible to obtain a solution When the solution is a point of tangency to the x axis When the so...

Page 180: ...152 ...

Page 181: ...phs on an existing graph Note that Sketch function operation in the STAT GRAPH TABLE RECUR and CONICS Modes is different from Sketch function operation in the RUN and PRGM Modes 10 1 Before Using the Sketch Function 10 2 Graphing with the Sketch Function Chapter 10 ...

Page 182: ...s appear only when you display the sketch menu while in the GRAPH and TABLE Modes PLOT plot menu LINE line menu Crcl Vert Hztl circle vertical line horizontal line PEN freehand drawing Text comment text RUN PRGM Mode GRPH graph command menu PIXL pixel menu Test tests pixel on off status Other menu items are identical to those in the STAT GRAPH TABLE RECUR CONICS Mode menu P 166 P 155 P 157 P 158 P...

Page 183: ... 2 x 2 The following are the View Window parameters used when drawing the graph Xmin 5 Ymin 5 Xmax 5 Ymax 5 Xscale 1 Yscale 1 k k k k k Tangent Sketch Tang This function lets you draw a line that is tangent to a graph at any point u u u u uTo draw a tangent in the GRAPH or TABLE Mode Example To draw a line that is tangent to point x 2 y 0 of y x x 2 x 2 1 After graphing the function display the sk...

Page 184: ... the tangent line k k k k k Line Normal to a Curve Sketch Norm With this function you can draw a line that is normal to the curve at a specific point A line that is normal to the curve at a given point is one that is perpendicular to the tangent line at that point u u u u uTo draw a line normal to a curve in the GRAPH or TABLE Mode Example To draw a line that is normal to the curve at point x 2 y ...

Page 185: ... in the GRAPH or TABLE Mode Example To graph the inverse of y x x 2 x 2 After graphing the function display the sketch menu and press 4 Inv When graphing an inverse function when there is more than one graph function stored in memory select one of the functions and then press w u u u u uTo graph an inverse function in the RUN or PRGM Mode The following is the syntax for graphing an inverse functio...

Page 186: ...n the graph of y x x 2 x 2 1 After drawing the graph display the sketch menu and press6 g 1 PLOT 1 Plot to display the pointer in the center of the screen 2 Use the cursor keys to move the pointer the locations of the points you want to plot and press w to plot You can plot as many points as you want The current x and y coordinate values are assigned respectively to variables X and Y u u u u uTo p...

Page 187: ...Y k k k k k Turning Plot Points On and Off Sketch PLOT Pl On Pl Off Pl Chg Use the following procedures to turn specific plot points on and off u u u u uTo turn plot points on and off in the STAT GRAPH TABLE RECUR and CONICS Modes To turn a plot point on 1 After drawing the graph display the sketch menu and press 6 g 1 PLOT 2 Pl On to display the pointer in the center of the screen 2 Use the curso...

Page 188: ...the line menu Line Draw a line between two plotted points F Line Draw a line u u u u uTo connect two plotted points with a line in the STAT GRAPH TABLE RECUR and CONICS Modes Sketch LINE Line Example To draw a line between the local maximun and local minimum on the graph of y x x 2 x 2 Use the same View Window parameters as in the example on page 155 1 After drawing a graph display the sketch menu...

Page 189: ...er drawing a graph display the sketch menu and then press 6 g 2 LINE 2 F Line to display the pointer in the center of the screen 2 Use the cursor keys to move the pointer to the local maximum and press w 3 Use the cursor keys to move the pointer to the local minimum and press w to draw the line u u u u uTo draw a line in the RUN or PRGM Mode The following is the syntax for drawing lines in these m...

Page 190: ...er of the screen 2 Use the cursor keys to move the pointer to the location where you want the center point of the circle to be and press w to plot it 3 Use the cursor keys to move the pointer to a point on the circumference of the circle here to point x 0 and then press w to draw the circle u u u u uTo draw a circle in the RUN or PRGM Mode The following is the syntax for drawing circles in these m...

Page 191: ...e the line left and right and press w to draw the line at the current location To draw a horizontal line simply press 5 Hztl in place of 4 Vert and use the f and c cursor keys to move the horizontal line on the display u u u u uTo draw vertical and horizontal lines in the RUN or PRGM Mode The following is the syntax for drawing vertical and horizontal lines in these modes To draw a vertical line V...

Page 192: ... to quit the freehand draw operation k k k k k Comment Text Sketch Text Use the following procedure to insert text for comments and labels into a graph u u u u uTo insert text in the STAT GRAPH TABLE RECUR and CONICS Modes Example To insert the graph function as comment text into the graph of y x x 2 x 2 1 After drawing a graph display the sketch menu and then press 6 g 6 g 2 Text to display the p...

Page 193: ... comment text insert operation more than once k k k k k Turning Pixels On and Off Sketch PIXL The following procedure lets you turn each individual screen pixel on and off You can specify any pixel from the upper left hand corner 1 1 to the lower right hand corner 63 127 of the screen Line range 1 to 63 Column range 1 to 127 Note that you can turn pixels on and off only in the RUN and PRGM Modes W...

Page 194: ...mber results in an error Pixel operations are valid only within the allowable line and column ranges k k k k k Clearing Drawn Lines and Points Sketch Cls The following operation clears all drawn lines and points from the screen u u u u uTo clear lines and points in the STAT GRAPH TABLE RECUR and CONICS Modes Lines and points drawn using sketch menu functions are temporary Display the sketch menu a...

Page 195: ...Dual Graph gives you valuable graph analysis capabilities You should be familiar with the contents of 8 3 Graph Function Operations before reading this chapter 11 1 Before Using Dual Graph 11 2 Specifying the Left and Right View Window Parameters 11 3 Drawing a Graph in the Active Screen 11 4 Displaying a Graph in the Inactive Screen Chapter 11 ...

Page 196: ...To execute a function on the right side inactive graph you must first make it active by moving it into the active screen Active Screen Actual graph drawing is done here Inactive Screen Use the inactive screen to make copies of active screen graphs and for the result of Zoom operations Indicators appear to the right of the formulas in the function memory list to tell where graphs are drawn with Dua...

Page 197: ...ndow setting store recall RIGHT LEFT active left inactive right screen View Window setting swap Use the procedures described under View Window V Window Settings to input parameter values Use the following key operations to change to different screens while inputting View Window parameters for the left and right side screens While the View Window parameter setting screen for the active graph is sho...

Page 198: ...ove the graph to the inactive screen u u u u uDrawing a graph in the active screen Example To draw the graph of y x x 1 x 1 in the active screen Use the following View Window parameters Xmin 2 Ymin 2 Xmax 2 Ymax 2 Xscale 0 5 Yscale 1 Input the function v v b v b Store the function w Draw the graph 6 DRAW or w ...

Page 199: ... COPY copies active graph to inactive screen SWAP switches active screen and inactive screen PICT picture function k k k k k Copying the Active Graph to the Inactive Screen Example To draw the graph for y x x 1 x 1 on the active screen and the inactive screen Use the following View Window parameters Active Left Screen Inactive Right Screen View Window parameters View Window parameters Xmin 2 Ymin ...

Page 200: ...ed Active Screen y x x 1 x 1 Inactive Screen y 2x2 3 Use the View Window parameters shown below Active Left Screen Inactive Right Screen View Window parameters View Window parameters Xmin 4 Ymin 5 Xmin 2 Ymin 2 Xmax 4 Ymax 5 Xmax 2 Ymax 2 Xscale 1 Yscale 1 Xscale 0 5 Yscale 1 Assume that the functions being graphed are stored in memory areas Y1 and Y2 Select the function for the graph that you wan...

Page 201: ...active left screen A1 SEL Draw the graph 6 DRAW At this point you could perform a copy operation and superimpose the active graph over the inactive graph K1 COPY Pressing 6 G T lets you switch between display of the active and inactive graphs using the entire display for each 6 G T 6 G T 6 G T Displaying a Graph in the Inactive Screen 11 4 ...

Page 202: ...llowing shows some example operations using the zoom function Example 1 To use box zoom to enlarge the graph of y x x 1 x 1 Use the following View Window parameters for the active graph Xmin 2 Ymin 2 Xmax 2 Ymax 2 Xscale 0 5 Yscale 1 Assume that the function is already stored in memory area Y1 Press 6 DRAW or w to draw the graph 2 Zoom 1 BOX Use the cursor keys to move the pointer to one of the co...

Page 203: ...ts current coordinates inside the table whenever you want This function is very useful for summarizing graph analysis results Be sure to read Chapter 8 Graphing and Chapter 9 Graph Solve before trying to perform any of the operations described in this chapter 12 1 Before Using Graph to Table 12 2 Using Graph to Table 12 Chapter ...

Page 204: ...g of the items in the function menu at the bottom of the screen see 8 1 Before Trying to Draw a Graph Whenever the set up screen s Dual Screen item is set to G to T you can only store rectangular coordinate Y polar coordinate r and parametric function graphs in memory You cannot use Graph to Table to display split graph table screens using X constant or inequality graphs of functions stored in the...

Page 205: ... Y2 x 2 Use the following View Window parameters Xmin 5 Ymin 10 Xmax 5 Ymax 10 Xscale 1 Yscale 2 1 Input the two functions 2 Press 6 DRAW or w to draw the graph in the left half of the screen 3 Press 1 Trace and then use d to move the pointer to the first intersection 4 Press w to store the coordinates of the pointer location in the table on the right side of the screen 5 Use e to move the pointer...

Page 206: ...p 6 of the previous example press K The following function menu appears CHNG changes the active screen between left and right LMEM saves table column to list file PICT saves graph data to graph memory 2 Press 2 LMEM 3 Press 1 List1 to store the data in the x coordinate column into List 1 Table data uses the same memory as TABLE menu table data Always be sure to store table data into a list Any of ...

Page 207: ...ing integra tion calculations Graph functions cannot be used while the highlighting is blinking in the table To clear the highlighting and make the graph side the active screen press K 1 CHNG K key operation is disabled whenever a graph and table are both on the screen and there is no numeric data in the table and when the screen is not split i e when either the graph or table only is on the displ...

Page 208: ...180 ...

Page 209: ...at happens to a graph when such changes are made For example you can see the graph change as illustrated here as the value of coefficient A changes in the formula y Ax2 13 1 Before Using Dynamic Graph 13 2 Storing Editing and Selecting Dynamic Graph Functions 13 3 Drawing a Dynamic Graph 13 4 Using Dynamic Graph Memory 13 5 Dynamic Graph Application Examples Chapter 13 ...

Page 210: ... and f to move SEL dynamic Graph draw non draw status DEL function delete TYPE function type specification VAR coefficient menu B IN menu of built in functions RCL recall and execution of Dynamic Graph conditions and screen data The built in function menu contains the following seven functions Y AX B Y A X B 2 C Y AX2 BX C Y AX 3 BX2 CX D Y Asin BX C Y Acos BX C Y Atan BX C P 184 P 190 ...

Page 211: ...re identical to those you use in the GRAPH Mode For details see 8 3 Graph Function Operations Dynamic Graphs can be one of the following three types only rectangular coordinate Y polar coordinate r and parametric You cannot use Dynamic Graph with X constant or inequality graphs of functions stored in the GRAPH or TABLE Mode If you try to use Dynamic Graph with a function that does not contain a va...

Page 212: ...namic coefficient If the range of the dynamic coefficient is already defined from a previous operation you can skip this step 5 Specify the speed of the draw operation If the speed is already defined from a previous operation you can skip this step 6 Draw the Dynamic Graph u u u u uTo set Dynamic Graph conditions Example To use Dynamic Graph to graph y A x 1 2 1 as the value of A changes from 2 to...

Page 213: ...each variable If a complex number is assigned to a variable only the integer part appears All variables contained in the currently selected function appear on the display in alphabetical order If there is more than one function that can be drawn using Dynamic Graph the message Too Many Functions appears on the display If the value of the dynamic variable is zero and you press 5 AUTO the dynamic va...

Page 214: ...start the Dynamic Graph draw operation There are four different variations for Dynamic Graphing k k k k k 10 time Continuous Drawing Select Stop as the draw type Dynamic Type to perform 10 time continuous drawing With this drawing style 10 versions of the graph are drawn and then the draw operation stops automatically Example To use 10 time continuous drawing to draw the same graph that you drew i...

Page 215: ...values shown on the display with the graph use the graph function set up display to switch Graph Func Off Pressing 5 AUTO draws up to 11 versions of the Dynamic Graph starting from the start Start value of the dynamic coefficient k k k k k Continuous Drawing When the Dynamic Graph draw type Dynamic Type is set to Cont continuous drawing of the Dynamic Graph continues until you press A Example To c...

Page 216: ...ample page 184 1 Display the coefficient value specification display and press 3 SPEED 2 Use f and c to select STOP GO and press 1 SEL J 3 Start drawing of the Dynamic Graph 6 DYNA w w Pressing A while the Dynamic Graph is being drawn changes to the drawing speed setting display The draw operation is suspended at this time and you can view the graph by pressing 6 G T k k k k k Overwriting By turni...

Page 217: ...use the following procedure to adjust the Dynamic Graph speed while the draw operation is taking place 1 While a Dynamic Graph draw operation is being performed press A to change to the speed adjustment menu tg tg tg tg tg Each step of the Dynamic Graph draw operation is performed each time you press w g g g g g h h h h h slow 1 2 speed normal default speed fast double speed STO stores graph condi...

Page 218: ...Dynamic Graph draw operation is being performed press A to change to the speed adjustment menu 2 Press 5 STO to store the data If there is already data stored in Dynamic Graph memory the above operation replaces it with the new data u u u u uTo recall data from Dynamic Graph memory 1 Display the Dynamic Graph function list 2 Press 6 RCL to recall all the data stored in Dynamic Graph memory Data re...

Page 219: ...42 Ymax 16 Tθmax 6 Xscale 5 Yscale 2 pitch 0 1 With the initial velocity defined as V and the angle defined as θ the parabolas can be obtained using the following expressions X Vcos θ T Y Vsin θ T 1 2 gT2 g 9 8 meters per second 1 Input the functions making sure to specify them a Param parametric type 2 Display the coefficient menu and specify the dynamic coefficient 4 VAR daw 3 Display the coeffi...

Page 220: ...192 ...

Page 221: ... following types of conic sections using the calculator s built in functions Parabolic graph Circle graph Elliptical graph Hyperbolic graph 14 1 Before Graphing a Conic Section 14 2 Graphing a Conic Section 14 3 Conic Section Graph Analysis Chapter 14 ...

Page 222: ...ollowing built in function menu appears on the screen 2 Use f and c to highlight the built in function you want and then press w The following nine functions are built in Graph Type Function Parabola X A Y K 2 H X AY2 BY C Y A X H 2 K Y AX2 BX C Circle X H 2 Y K 2 R2 AX2 AY2 BX CY D 0 Ellipse X H 2 Y K 2 1 A2 B2 Hyperbola X H 2 Y K 2 1 A2 B2 Y K 2 X H 2 1 A2 B2 ...

Page 223: ... to each variable which are general variables used by the calculator If the values include an imaginary part only the real part appears on the display 3 Assign values to each variable bwbwcw You can also use f and c to highlight a variable and then input a value 4 Press 6 DRAW to draw the graph Certain View Window parameters can make a circle graph come out looking like an ellipse When this happen...

Page 224: ...u want to draw ccccccc 2 Press w and the variable input screen appears 3 Assign values to each variable cwcwdwbw 4 Press 6 DRAW to draw the graph k k k k k Conic Section Graphing Precautions Assigning the following types of values to variables contained in built in function produces an error 1 Parabola graph A 0 2 Circle graph R 0 for X H 2 Y K 2 R2 A 0 for AX2 AY2 BX CY D 0 3 Ellipse hyperbola gr...

Page 225: ...m fixed line l and fixed point F not on the line Fixed point F is the focus fixed line l is the directrix the horizontal line that passes through the focus directrix is the axis of symme try the length of a straight line that intersects the parabola passes through the locus and is parallel to fixed line l is the latus rectum and point A where the parabola intersects the axis of symmetry is the ver...

Page 226: ...s A and A where the hyperbola intersects the x axis are the vertexes the x coordinate values of vertexes A and A are called x intercepts the y coordinate values of vertexes A and A are called y intercepts and straight lines l and l which get closer to the hyperbola as they move away from the foci are asymptotes 14 2 Graphing a Conic Section Vertex A Vertex A Focus F Focus F Asymptote l Asymptote l...

Page 227: ...raws the axis of symmetry directrix VTX LEN determines the vertex latus rectum Circle Graph Analysis CNTR RADS determines the center radius Ellipse Graph Analysis FOCS X IN Y IN determines the focus x intercept y intercept Hyperbolic Graph Analysis FOCS X IN Y IN VTX determines the focus x intercept y intercept vertex ASYM draws the asymptote The following examples show how to use the above menus ...

Page 228: ...o the first vertex u u u u uTo calculate the latus rectum G Solv LEN Example To determine the latus rectum for the parabola X Y 2 2 3 Use the following View Window parameters Xmin 1 Ymin 5 Xmax 10 Ymax 5 Xscale 1 Yscale 1 5 G Solv 5 LEN Calculates the latus rectum u u u u uTo calculate the center and radius G Solv CNTR RADS Example To determine the center and radius for the circle X2 Y2 2X 2Y 3 0 ...

Page 229: ...nd y intercepts for the hyperbola X 1 2 Y 1 2 1 22 22 Use the following View Window parameters Xmin 6 3 Ymin 3 1 Xmax 6 3 Ymax 3 1 Xscale 1 Yscale 1 5 G Solv 2 X IN Calculates the x intercept 5 G Solv 3 Y IN Calculates the y intercept Press e to calculate the second set of x y intercepts Pressing d returns to the first set of intercepts Conic Section Graph Analysis 14 3 ...

Page 230: ... 3 Ymin 3 1 Xmax 6 3 Ymax 3 1 Xscale 1 Yscale 1 5 G Solv 2 SYM Draws the axis of symmetry 5 G Solv 3 DIR Draws the directrix u u u u uTo draw and analyze the asymptotes G Solv ASYM Example To draw the asymptotes for the hyperbola X 1 2 Y 1 2 1 22 22 Use the following View Window parameters Xmin 6 3 Ymin 5 Xmax 6 3 Ymax 5 Xscale 1 Yscale 1 5 G Solv 5 ASYM Draws the asymptotes 14 3 Conic Section Gra...

Page 231: ...ppears on the display when graph analysis is unable to produce a result The following can result in inaccurate analysis results or may even make it impossible to obtain a solution at all When the solution is tangent to the x axis When the solution is a point of tangency between two graphs Conic Section Graph Analysis 14 3 ...

Page 232: ...204 ...

Page 233: ...lues for graphing Because of this Table Graph makes it easy to grasp the nature of numeric tables and recursion formulas 15 1 Before Using Table Graph 15 2 Storing a Function and Generating a Numeric Table 15 3 Editing and Deleting Functions 15 4 Editing Tables and Drawing Graphs 15 5 Copying a Table Column to a List Chapter 15 ...

Page 234: ...ppears on the display SEL numeric table generation non generation status DEL function delete TYPE function type specification COLR graph color specification RANG table range specification screen TABL start numeric table generation Note that the RANG item does not appear when a list name is specified for the Variable item in the set up screen CFX ...

Page 235: ...e Table range method With this method you specify the conditions for the change in value of the variable List With this method you substitute the values contained in a previously created list for the value of the variable u u u u uTo generate a table using a table range Example To generate a table as the value of variable x changes from 3 to 3 in increments of 1 5 RANG dwdwbw The numeric table ran...

Page 236: ...Variable item of the set up screen k k k k k Generating a Table Example To generate a table of values for the functions stored in memory areas Y1 and Y3 of the TABLE Mode function list Use f and c to move the highlighting to the function you want to generate a table for and press 1 SEL to select it The sign of selected functions is highlighted on the screen To deselect a function move the cursor t...

Page 237: ... setting of set up screen s Derivative item to On causes a numeric table that includes the derivative to be displayed whenever you generate a numeric table An error occurs if a graph for which a range is specified or an overwrite graph is included among the graph expressions k k k k k Specifying the function type You can specify a function as being one of three types Rectangular coordinate Y Polar...

Page 238: ...function you want to edit Use d and e to move the cursor to the location of the change eeeeef w 6 TABL The Function Link Feature automatically reflects any changes you make to functions in the TABLE Mode list in the GRAPH Mode and DYNA Mode lists u u u u uTo delete a function 1 Use f and c to move the highlighting to the function you want to delete and then press 2 DEL 2 Press 1 YES to delete the ...

Page 239: ...delete table ROW display menu of row operations G CON G PLT connected type draw plot type graph draw u u u u uTo change variable values in a table Example To change the value in Column x Row 3 of the table generated on page 208 from 1 to 2 5 cc c fw When you change a variable value in Column x all values in the columns to the right are recalculated and displayed If you try to replace a value with ...

Page 240: ...w Example To delete Row 2 of the table generated on page 208 3 ROW c 1 DEL u u u u uTo insert a row Example To insert a new row between Rows 1 and 2 in the table gener ated on page 208 3 ROW c 2 INS u u u u uTo add a row Example To add a new row below Row 7 in the table generated on page 208 3 ROW cccccc 3 ADD 15 4 Editing Tables and Drawing Graphs 1 2 3 4 5 6 1 2 3 4 5 6 1 2 3 4 5 6 ...

Page 241: ...re to change the graph color to orange or green 1 Display the function list and then use f and c to highlight the function whose graph color you want to change 2 Press 4 COLR 3 Press the function key that corresponds to the color you want to specify Blue Orng Grn blue orange green u u u u uTo specify the draw non draw status of a formula There are two options for the draw non draw status of a func...

Page 242: ... the functions Example To use the values in the numeric table generated using the Table Range and the View Window parameters from the previous example to graph all functions stored in memory as plot type graphs 6 TABL 6 G PLT Specifies plot type graph After you graph a function you can press 6 G T or A to return to the function s numeric table After graphing a function you can use the trace zoom s...

Page 243: ...th the graph and its table Use the same View Window parameters as in the example on page 214 Display the set up screen and specify T G for Dual Screen Press J 6 TABL Shows the table 6 G PLT Draws plot type graph Pressing 6 G T causes the graph on the left side of the Dual Screen to fill the entire display Note that you cannot use the sketch function while a graph is displayed using 6 G T P 7 1 2 3...

Page 244: ...ts of a numeric table column into a list u u u u uTo copy a table to a list Example To copy the contents of Column x into List 1 K1 LIST 2 LMEM You can select any row of the column you want to copy Press the function key that corresponds the list you want to copy to 1 List1 1 2 3 4 5 6 ...

Page 245: ...eneral term of sequence an made up of an and n Formulas for linear recursion between two terms made up of an 1 an and n Formulas for linear recursion between three terms made up of an 2 an 1 an and n 16 1 Before Using the Recursion Table and Graph Function 16 2 Inputting a Recursion Formula and Generating a Table 16 3 Editing Tables and Drawing Graphs Chapter 16 ...

Page 246: ...rsion formula type specification n an menu for input of variable n and general terms an and bn RANG screen for setting of table range TABL recursion formula table generation u u u u uTo specify the recursion formula type Before inputting a recursion formula you must first specify its type 1 In the Recursion Menu press 3 TYPE In this display an An B is the general term an A n B of an 2 Press the fu...

Page 247: ... formula and the initial term of the numeric value table You should also specify a starting point for the pointer when drawing a convergence diver gence graph WEB graph for a formula for linear recursion between two terms Start Starting value of variable n End Ending value of variable n a0 b0 Value of 0th term a0 b0 a1 b1 Value of 1st term a1 b1 anStr bnStr Pointer starting point for convergence d...

Page 248: ...2 1 1 Specify the recursion formula type as linear recursion between three terms and then input the formula 3 TYPE 3 an 2 4 n an 3 an 1 2 an 2 Press w and then press 5 RANG to display the table range setting screen which contains the following items a0 a1 setting of value for a0 b0 and a1 b1 a1 b1 and a2 b2 The table range settings specify the conditions that control the value of variable n in the...

Page 249: ...integer part of the value When Start 0 and a1 b1 is selected as the initial term the calculator changes to Start 1 and generates the table When Start End the calculator swaps the Start and End values and generates the table When Start End the calculator generates a table for Start values only If the start value is very large it may take a long time to generate a table for linear recursion between ...

Page 250: ... table Each press of 1 SEL toggles a table between generation and non generation u u u u uTo change the contents of a recursion formula Changing the contents of a recursion formula causes the values in the table to be updated using the current table range settings Example To change an 1 2an 1 to an 1 2an 3 e Displays the cursor ee dw Changes the formula contents 6 TABL u u u u uTo delete a recursi...

Page 251: ...rgence WEB graph draw G CON G PLT connected type draw plot type recursion graph draw The WEB item is available only when a table generated using a formula for linear recursion between two terms an 1 bn 1 is on the display u u u u uTo delete a recursion table 1 Display the recursion table you want to delete and then press 2 DEL 2 Press 1 YES to delete the table or 6 NO to abort the operation withou...

Page 252: ...raw non draw status use same procedure as that for specifying generation non generation status u u u u uTo specify the type of data to be plotted Σ Display On You can specify one of two types of data for plotting an on the vertical axis n on the horizontal axis Σan on the vertical axis n on the horizontal axis In the function menu that appears while a table is on the display press 5 G CON or 6 G P...

Page 253: ...aph WEB graph With this feature you can draw a graph of an 1 f an where an 1 and an are the terms of linear recursion between two terms substituted respectively for y and x in the function y f x The resulting graph can then be viewed to determine whether or not the graph is convergent or divergent Example 1 To determine whether or not the recursion formula an 1 3an 2 3an is convergent or divergent...

Page 254: ...e display w w This graph indicates that recursion formula an 1 3an 2 3an is convergent Example 2 To determine whether or not the recursion formula bn 1 3bn 0 2 is convergent or divergent Use the following table range Start 0 End 6 b0 0 02 bn Str 0 02 Use the View Window parameters from Example 1 1 Press 6 TABL 4 WEB to draw the graph 16 3 Editing Tables and Drawing Graphs ...

Page 255: ...start point is always 0 3 Each press of w draws web like lines on the display w w This graph indicates that recursion formula bn 1 3bn 0 2 is divergent Inputting bn or n for the expression an 1 or Inputting an or n for the expression bn 1 for linear recursion between two terms causes an error Editing Tables and Drawing Graphs 16 3 ...

Page 256: ...ical table of values Example To draw the graph of an 1 2an 1 from Example 1 displaying both the graph and its table Display the set up screen and specify T G for Dual Screen Press J 6 TABL Shows the table 6 G PLT Draws plot type graph Pressing 6 G T causes the graph on the left side of the Dual Screen to fill the entire display Note that you cannot use the sketch function while a graph is displaye...

Page 257: ...l and matrix calculations and for graphing 17 1 List Operations 17 2 Editing and Rearranging Lists 17 3 Manipulating List Data 17 4 Arithmetic Calculations Using Lists 17 5 Switching Between List Files Element number Display range Cell Row List name Column List 1 List 2 List 3 List 4 List 5 List 6 1 56 1 107 3 5 4 0 2 37 2 75 6 0 0 3 21 4 122 2 1 0 0 4 69 8 87 4 4 2 0 5 40 16 298 3 0 0 6 48 32 48 ...

Page 258: ...generated by GRAPH TO TABLE to a list w List internal operations w Memory transfer Generating a table by defining a list as the variable K 1 LIST 2 LMEM 4 List4 Inside list Copying the column of a specific table to a specific list w Memory transfer Example To send column 1 of Mat A to a list Graph Operation List graphing Y1 List 1X ...

Page 259: ...ntain a value The screen automatically scrolls when the highlighting is located at either edge of the screen The following example procedure is performed starting with the highlighting located at Cell 1 of List 1 1 Input a value and press w to store it in the list dw 2 The highlighting automatically moves down to the next cell for input Note that you can also input the result of an expression in a...

Page 260: ...hould not input a comma after the final value of the set you are inputting Right 34 53 78 Wrong 34 53 78 You can also use list names inside of a mathematical expression to input values into another cell The following example shows how to add the values in each row in List 1 and List 2 and input the result into List 3 1 Use the cursor keys to move the highlighting to the name of the list where you ...

Page 261: ...the above cell delete operation does not affect cells in other lists If the data in the list whose cell you delete is somehow related to the data in neighboring lists deleting a cell can cause related values to become misaligned u u u u uTo delete all cells in a list Use the following procedure to delete all the data in a list 1 Use the cursor key to move the highlighting to any cell of the list w...

Page 262: ... you insert a cell is somehow related to the data in neighboring lists inserting a cell can cause related values to become misaligned k k k k k Sorting List Values You can sort lists into either ascending or descending order The highlighting can be located in any cell of the list u u u u uTo sort a single list Ascending order 1 While the lists are on the screen press 1 SRT A 2 The prompt How Many ...

Page 263: ...er ascending order or descending order while the cells of the linked lists are arranged so that the relative relationship of all the rows is maintained Ascending order 1 While the lists are on the screen press 1 SRT A 2 The prompt How Many Lists H appears to ask how many lists you want to sort Here we will sort one base list linked to one other list so we should input 2 cw 3 In response to the Sel...

Page 264: ...s that you should press 2 SRT D in place of 1 SRT A You can sort up to six lists at one time If you specify a list more than once for a single sort operation an error occurs An error also occurs if lists specified for sorting do not have the same number of values rows 17 2 Editing and Rearranging Lists ...

Page 265: ...following items List L M Dim Fill Seq Min Max Mean Med Sum Prod Cuml A A A A A Note that all closing parentheses at the end of the following operations can be omitted u u u u uTo count the number of values OPTN LIST Dim K1 LIST 3 Dim 1 List list number 1 6 w The number of cells that contain data in a list is called its dimension Example To enter the RUN Mode and count the number of values in List ...

Page 266: ...a 2 row 3 column matrix with each cell containing 0 in Matrix A A c d a K1 LIST 3 Dim J 2 MAT 1 Mat aAw u u u u uTo replace all cell values with the same value OPTN LIST Fill K 1 LIST 4 Fill value 1 List list number 1 6 w Example To replace all values in List 1 with the number 3 AK1 LIST 4 Fill d 1 List b w The following shows the new contents of List 1 u u u u uTo generate a sequence of numbers O...

Page 267: ...ind the minimum value in List 1 36 16 58 46 56 AK1 LIST 6 g 1 Min 6 g 6 g 1 List b w u u u u uTo find the maximum value in a list OPTN LIST Max Use the same procedure as when finding the minimum value Min except press 2 Max in place of 1 Min u u u u uTo find which of two lists contains the smallest value OPTN LIST Min K1 LIST 6 g 1 Min 6 g 6 g 1 List list number 1 6 1 List list number 1 6 w The tw...

Page 268: ... that contains values and one that contains the number of occurrences of each value The frequency of the data in Cell 1 of the first list is indicated by the value in Cell 1 of the second list etc The two lists must contain the same number of data items Otherwise an error occurs K1 LIST 6 g 3 Mean 6 g 6 g 1 List list number 1 6 data 1 List list number 1 6 frequency w Example To calculate the mean ...

Page 269: ...6 whose frequency is indicated by List 2 75 89 98 72 67 AK1 LIST 6 g 4 Med 6 g 6 g 1 List b 1 List c w u u u u uTo calculate the sum of values in a list OPTN LIST Sum K1 LIST 6 g 6 g 1 Sum 6 g 1 List list number 1 6 w Example To calculate the sum of values in List 1 36 16 58 46 56 AK1 LIST 6 g 6 g 1 Sum 6 g 1 List bw u u u u uTo calculate the product of values in a list OPTN LIST Prod K1 LIST 6 g ...

Page 270: ...n ListAns Memory Example To calculate the percentage represented by each value in List 1 2 3 6 5 4 AK1 LIST 6 g 6 g 4 6 g 1 List bw u u u u uTo calculate the differences between neighboring data inside a list OPTN LIST A A A A A K1 LIST 6 g 6 g 5 A 6 g list number 1 6 w The result of this operation is stored in ListAns memory Example To calculate the difference between the values in List 1 1 3 8 5...

Page 271: ...e number of cells in the original list Note that an error occurs if you execute A List for a list that has no data or only one data item u u u u uTo transfer list contents to Matrix Answer Memory OPTN LIST L M K1 LIST 2 L M 1 List list number 1 6 1 List list number 1 6 w You can input the following as many times as necessary to specify more than one list in the above operation list number 1 6 Exam...

Page 272: ...ferent dimensions An error occurs whenever an operation involving any two cells generates a mathematical error k k k k k Inputting a List into a Calculation There are two methods you can use to input a list into a calculation u u u u uTo input a specific list by name Example To input List 6 1 Press K to display the first Operation Menu This is the function key menu that appears in the RUN Mode whe...

Page 273: ...gf cc Example 2 To assign the list in ListAns Memory to List 1 K1 LIST 1 List Ka1 List bw u u u u uTo input a single list cell value into a calculation You can extract the value in a specific cell of a list and use it in a calculation Specify the cell number by enclosing it between square brackets using the and keys Example To calculate the sine of the value stored in Cell 3 of List 2 sK1 LIST 1 L...

Page 274: ...unction such as Y1 List1 X If List 1 is 1 2 3 this function will produces three graphs Y X Y 2X Y 3X P 111 There are certain limitations on using lists with graphing functions k k k k k Inputting Scientific Calculations into a List You can use the numeric table generation functions in the Table Graph Menu to input values that result from certain scientific function calculations into a list To do t...

Page 275: ...t d operation in the above procedure you could input eb gf cc 1 4 Example 2 To use List 1 2 and List 2 5 to perform List 1List 2 3 6 List1MList2w This creates a list with the results of 14 25 36 1 The resulting list 32 is stored in ListAns Memory 729 Arithmetic Calculations Using Lists 17 4 ...

Page 276: ...st files u u u u uTo switch between list files In the Main Menu select the LIST icon and enter the LIST Mode Press Z to display the LIST Mode set up screen Press the function key to select the file you want Example To select File 3 3 File3 J All subsequent list operations are applied to the lists contained in the file you select List File3 in the above example ...

Page 277: ...18 3 Calculating and Graphing Single Variable Statistical Data 18 4 Calculating and Graphing Paired Variable Statistical Data 18 5 Performing Statistical Calculations 18 6 Tests 18 7 Confidence Interval 18 8 Distribution Important This chapter contains a number of graph screen shots In each case new data values were input in order to highlight the particular characteristics of the graph being draw...

Page 278: ...the highlighting around the lists P 251 GRPH graph menu P 270 CALC statistical calculation menu P 277 TEST test menu P 294 INTR confidence interval menu P 304 DIST distribution menu P 234 SRT A SRT D ascending descending sort P 233 DEL DEL A deletes highlighted data all data P 234 INS inserts new cell at highlighted cell The procedures you should use for data editing are identical to those you use...

Page 279: ...t values can be up to 10 digits long You can use the f c d and e keys to move the highlighting to any cell in the lists for data input k k k k k Plotting a Scatter Diagram Use the data input above to plot a scatter diagram 1 GRPH 1 GPH1 To return to the statistical data list press J or Q View Window parameters are normally set automatically for statistical graphing If you want to set View Window p...

Page 280: ... is on the display press 1 GRPH to display the graph menu which contains the following items GPH1 GPH2 GPH3 only one graph 1 2 3 drawing The initial default graph type setting for all the graphs Graph 1 through Graph 3 is scatter diagram but you can change to one of a number of other graph types P 252 SEL simultaneous graph GPH1 GPH2 GPH3 selection P 254 SET graph settings graph type list assignme...

Page 281: ...iety of other statistical graph types for each graph List The initial default statistical data is List 1 for single variable data and List 1 and List 2 for paired variable data You can specify which statistical data list you want to use for x data and y data Frequency Normally each data item or data pair in the statistical data list is represented on a graph as a point When you are working with a ...

Page 282: ...3 X 4 linear regression graph Med Med graph quadratic regression graph cubic regression graph quartic regression graph Log Exp Pwr Sin Lgst logarithmic regression graph exponential regression graph power regression graph sine regression graph logistic regression graph u u u u uXList x axis data list List1 List2 List3 List4 List5 List6 List 1 List 2 List 3 List 4 List 5 List 6 u u u u uYList y axis...

Page 283: ...n and plots the result The expected NPP values of the normal distribution are used as the vertical axis while the observed values of the variable being tested are on the horizontal axis Press J or Q to return to the statistical data list k k k k k Selecting the Regression Type After you graph paired variable statistical data you can use the function menu at the bottom of the display to select from...

Page 284: ...ression parameter calculation results while a scatter diagram is on the display 6 g 1 Log k k k k k Graphing Statistical Calculation Results You can use the parameter calculation result menu to graph the displayed regression formula P 268 COPY stores the displayed regression formula as a graph function DRAW graphs the displayed regression formula Example To graph a logarithmic regression While log...

Page 285: ...put in the statistical data list see Inputting Data into Lists Draw the graph using the procedure described under Changing Graph Parameters 6 DRAW The display screen appears as shown above before the graph is drawn At this point you can change the Start and pitch values k k k k k Med box Graph Med Box This type of graph lets you see how a large number of data items are grouped within specific rang...

Page 286: ...graph menu press 6 SET and then change the graph type of the graph you want to use GPH1 GPH2 GPH3 to mean box graph k k k k k Normal Distribution Curve P 254 The normal distribution curve is graphed using the following normal distribution Graph Type function N Dis y 1 2 π xσn e 2xσn 2 x x 2 The distribution of characteristics of items manufactured according to some fixed standard such as component...

Page 287: ...as shown above before the graph is drawn At this point you can change the Start and pitch values k k k k k Displaying Single Variable Statistical Results Single variable statistics can be expressed as both graphs and parameter values When these graphs are displayed the menu at the bottom of the screen appears as below 1VAR single variable calculation result menu Pressing 1 1VAR displays the follow...

Page 288: ...rtile _ x xσn data mean population standard deviation _ x xσn data mean population standard deviation maxX maximum Mod mode Press 6 DRAW to return to the original single variable statistical graph 18 3 Calculating and Graphing Single Variable Statistical Data ...

Page 289: ...c representation of this relationship is a linear regression graph Graph Type Q1 GRPH 6 SET c Scatter 1 Scat GPH1 Q1 GRPH 1 GPH1 X 1 X 1 2 3 4 5 6 6 DRAW a regression coefficient slope b regression constant term y intercept r correlation coefficient r2 coefficient of determination k k k k k Med Med Graph P 254 When it is suspected that there are a number of extreme values a Med Med graph can be us...

Page 290: ...egression Ex Quadratic regression 3 X 2 1 2 3 4 5 6 6 DRAW Quadratic regression a regression second coefficient b regression first coefficient c regression constant term y intercept Cubic regression a regression third coefficient b regression second coefficient c regression first coefficient d regression constant term y intercept Quartic regression a regression fourth coefficient b regression thir...

Page 291: ...tant term b regression coefficient r correlation coefficient r2 coefficient of determination k k k k k Exponential Regression Graph P 254 Exponential regression expresses y as a proportion of the exponential function of x The standard exponential regression formula is y a ebx so if we take the logarithms of both sides we get Iny Ina bx Next if we say Y Iny and A Ina the formula corresponds to line...

Page 292: ...4 5 6 6 DRAW a regression coefficient b regression power r correlation coefficient r2 coefficient of determination k k k k k Sine Regression Graph Sine regression is best applied for phenomena that repeats within a specific range such as tidal movements y a sin bx c d While the statistical data list is on the display perform the following key operation 6 g 5 Sin 6 DRAW Drawing a sine regression gr...

Page 293: ...1 159 144 66 46 40 32 32 39 44 112 116 152 157 109 130 59 40 42 33 32 40 71 138 203 162 154 136 39 32 35 32 31 35 80 134 184 219 87 38 36 33 40 30 36 55 94 Input the above data and plot a scatter diagram 1 GRPH 1 GPH1 Execute the calculation and produce sine regression analysis results 6 g 5 Sin Display a sine regression graph based on the analysis results 6 DRAW k k k k k Logistic Regression Grap...

Page 294: ...hich tracks the annual change in the diffusion rate to perform logistic regression List1 Year Data 66 67 68 69 70 71 72 73 74 75 76 77 78 79 80 81 82 83 List2 Diffusion Rate 0 3 1 6 5 4 13 9 26 3 42 3 61 1 75 8 85 9 90 3 93 7 95 4 97 8 97 8 98 2 98 5 98 9 98 8 1 GRPH 1 GPH1 Perform the calculation and the logistic regression analysis values appear on the display 6 g 6 g 1 Lgst 18 4 Calculating and...

Page 295: ...be stored Plots that are higher than the regression model are positive while those that are lower are negative Residual calculation can be performed and saved for all regression models Any data already existing in the selected list is cleared The residual of each plot is stored in the same precedence as the data used as the model k k k k k Displaying Paired Variable Statistical Results Paired vari...

Page 296: ...t data maxY maximum of yList data k k k k k Copying a Regression Graph Formula to the Graph Mode After you perform a regression calculation you can copy its formula to the GRAPH Mode The following are the functions that are available in the function menu at the bottom of the display while regression calculation results are on the screen COPY stores the displayed regression formula to the GRAPH Mod...

Page 297: ...ession calculations 6 DRAW P 254 1 X The text at the top of the screen indicates the currently selected graph StatGraph1 Graph 1 StatGraph2 Graph 2 StatGraph3 Graph 3 1 Use f and c to change the currently selected graph The graph name at the top of the screen changes when you do c 2 When graph you want to use is selected press w P 259 Now you can use the procedures under Displaying Single Variable...

Page 298: ... Freq specifies list where single variable frequency values Frequency are located 2Var XList specifies list where paired variable statistic x values XList are located 2Var YList specifies list where paired variable statistic y values YList are located 2Var Freq specifies list where paired variable frequency values Frequency are located Calculations in this section are performed based on the above ...

Page 299: ...of these statistical values see Displaying Paired Variable Statistical Results k k k k k Regression Calculation In the explanations from Linear Regression Graph to Logistic Regression Graph regression calculation results were displayed after the graph was drawn Here the regression line and regression curve is represented by mathematical expressions You can directly determine the same expression fr...

Page 300: ... values of and when xi 40 and yi 1000 1 In the Main Menu select the STAT icon and enter the STAT Mode 2 Input data into the list and draw the power regression graph 3 In the Main Menu select the RUN icon and enter the RUN Mode 4 Press the keys as follows ea value of xi K5 STAT 2 w The estimated value is displayed for xi 40 baaa value of yi 1 w The estimated value is displayed for yi 1000 1 GRPH 6 ...

Page 301: ... value t obtains normalized variate t x value Normal probability P t Q t and R t and normalized variate t x are calculated using the following formulas P t Q t R t du u2 du u2 du u2 Example The following table shows the results of measurements of the height of 20 college students Determine what percentage of the students fall in the range 160 5 cm to 175 5 cm Also in what percentile does the 175 5...

Page 302: ...6 g 3 PROB 6 g You obtain the normalized variate immediately after performing single variable statistical calculations only 4 t bga f w Normalized variate t for 160 5cm Result 1 633855948 1 634 4 t bhf f w Normalized variate t for 175 5cm Result 0 4963343361 0 496 1 P a ejg 1 P b gde w Percentage of total Result 0 638921 63 9 of total 3 R a ejg w Percentile Result 0 30995 31 0 percentile 18 5 Perf...

Page 303: ... Y in the Sketch Mode Example To graph normal probability P 0 5 Perform the following operation in the RUN Mode 4 Sketch 1 Cls w 5 GRPH 1 Y K6 g 3 PROB 6 g 1 P a f w The following shows the View Window settings for the graph Ymin Ymax 0 1 0 45 Xmin Xmax 3 2 3 2 Performing Statistical Calculations 18 5 ...

Page 304: ... is made whether the null hypothesis or alternative hypothesis will be adopted When the sample shows a trend the probability of the trend and to what extent it applies to the population is tested based on the sample size and variance size Inversely expressions related to the t test are also used to calculate the sample size required to improve probability The t test can be used even when the popul...

Page 305: ... Details concerning statistical principles and terminology can be found in any standard statistics textbook While the statistical data list is on the display press 3 TEST to display the test menu which contains the following items Z t CHI F Z t χ2 F test ANOV analysis of variance ANOVA About data type specification For some types of tests you can select data type using the following menu List Var ...

Page 306: ...lation or draws a graph The following shows the meaning of parameter data specification items that are different from list data specification o sample mean n sample size positive integer Example To perform a 1 Sample Z Test for one list of data For this example we will perform a µ µ0 test for the data List1 11 2 10 9 12 5 11 3 11 7 when µ0 11 5 and σ 3 1 List c2 c bb fw dw 1 List1 c1 1 c 1 CALC µ ...

Page 307: ...the following key operations from the statistical data list 3 TEST 1 Z 2 2 S The following shows the meaning of each item in the case of list data specification Data data type µ1 population mean value test conditions G µ2 specifies two tail test µ2 specifies one tail test where sample 1 is smaller than sample 2 µ2 specifies one tail test where sample 1 is greater than sample 2 σ1 population standa...

Page 308: ...re input For this example we will perform a µ1 µ2 test for the data List1 11 2 10 9 12 5 11 3 11 7 and List2 0 84 0 9 0 14 0 75 0 95 when σ1 15 5 and σ2 13 5 1 List c 2 c bf fw bd fw 1 List1 c2 List2 c 1 1 c1 1 c 1 CALC µ1 µ2 direction of test z z value p p value o1 sample 1 mean o2 sample 2 mean x1σn 1 sample 1 standard deviation x2σn 1 sample 2 standard deviation n1 sample 1 size n2 sample 2 siz...

Page 309: ...itions G p0 specifies two tail test p0 specifies lower one tail test p0 specifies upper one tail test p0 expected sample proportion 0 p0 1 x sample value x 0 integer n sample size positive integer Execute executes a calculation or draws a graph Example To perform a 1 Prop Z Test for specific expected sample proportion data value and sample size Perform the calculation using p0 0 5 x 2048 n 4040 1 ...

Page 310: ...e statistical data list 3 TEST 1 Z 4 2 P p1 sample proportion test conditions G p2 specifies two tail test p2 specifies one tail test where sample 1 is smaller than sample 2 p2 specifies one tail test where sample 1 is greater than sample 2 x1 sample 1 data value x1 0 integer n1 sample 1 size positive integer x2 sample 2 data value x2 0 integer n2 sample 2 size positive integer Execute executes a ...

Page 311: ...k t Test You can use the following menu to select a t test type 1 S 2 S REG 1 Sample 2 Sample LinearReg t Test u u u u u1 Sample t Test This test uses the hypothesis test for a single unknown population mean when the population standard deviation is unknown The 1 Sample t Test is applied to t distribution t o 0 µ σ x n 1 n o sample mean µ0 assumed population mean xσn 1 sample standard deviation n ...

Page 312: ...ning of parameter data specification items that are different from list data specification o sample mean xσn 1 sample standard deviation xσn 1 0 n sample size positive integer Example To perform a 1 Sample t Test for one list of data For this example we will perform a µ G G G G G µ0 test for the data List1 11 2 10 9 12 5 11 3 11 7 when µ0 11 3 1 List c 1 G c bb dw 1 List1 c1 1 c 1 CALC µ G 11 3 as...

Page 313: ...ect t o1 o2 x1 n 1 2 σ n1 x2 n 1 2 σ n2 df 1 C2 n1 1 1 C 2 n2 1 C x1 n 1 2 σ n1 x2 n 1 2 σ n2 x1 n 1 2 σ n1 Perform the following key operations from the statistical data list 3 TEST 2 t 2 2 S Tests 18 6 o1 sample 1 mean o2 sample 2 mean x1σn 1 sample 1 standard deviation x2σn 1 sample 2 standard deviation n1 sample 1 size n2 sample 2 size xpσn 1 pooled sample standard deviation df degrees of free...

Page 314: ...oled pooling On or Off Execute executes a calculation or draws a graph The following shows the meaning of parameter data specification items that are different from list data specification o1 sample 1 mean x1σn 1 sample 1 standard deviation x1σn 1 0 n1 sample 1 size positive integer o2 sample 2 mean x2σn 1 sample 2 standard deviation x2σn 1 0 n2 sample 2 size positive integer Example To perform a ...

Page 315: ...mple standard deviation u u u u uLinearReg t Test LinearReg t Test treats paired variable data sets as x y pairs and uses the method of least squares to determine the most appropriate a b coefficients of the data for the regression formula y a bx It also determines the correlation coefficient and t value and calculates the extent of the relationship between x and y b Σ x o y p i 1 n Σ x o 2 i 1 n ...

Page 316: ...ion Example To perform a LinearReg t Test when two lists of data are input For this example we will perform a LinearReg t Test for x axis data 0 5 1 2 2 4 4 5 2 and y axis data 2 1 0 3 1 5 5 2 4 1 G c 1 List1 c 2 List2 c 1 1 c 1 CALC β G 0 ρ G 0 direction of test t t value p p value df degrees of freedom a constant term b coefficient s standard error r correlation coefficient r2 coefficient of det...

Page 317: ...MAT Mode Perform the following key operations from the statistical data list 3 TEST 3 CHI Next specify the matrix that contains the data The following shows the meaning of the above item Observed name of matrix A to Z that contains observed counts all cells positive integers Execute executes a calculation or draws a graph The matrix must be at least two lines by two columns An error occurs if the ...

Page 318: ...1 2 σ x2 n 1 2 σ Perform the following key operations from the statistical data list 3 TEST 4 F The following is the meaning of each item in the case of list data specification Data data type σ1 population standard deviation test conditions G σ2 specifies two tail test σ2 specifies one tail test where sample 1 is smaller than sample 2 σ2 specifies one tail test where sample 1 is greater than sampl...

Page 319: ...perform a 2 Sample F Test when two lists of data are input For this example we will perform a 2 Sample F Test for the data List1 0 5 1 2 2 4 4 5 2 and List2 2 1 0 3 1 5 5 2 4 1 List c1 G c 1 List1 c2 List2 c 1 1 c1 1 c 1 CALC σ1Gσ2 direction of test F F value p p value x1σn 1 sample 1 standard deviation x2σn 1 sample 2 standard deviation o1 sample 1 mean o2 sample 2 mean n1 sample 1 size n2 sample...

Page 320: ...1 data List2 list whose contents you want to use as sample 2 data Execute executes a calculation A value from 2 through 6 can be specified in the How Many line so up to six samples can be used Example To perform one way ANOVA analysis of variance when three lists of data are input For this example we will perform analysis of variance for the data List1 6 7 8 6 7 List2 0 3 4 3 5 4 7 and List3 4 5 4...

Page 321: ...t3 c 1 CALC F F value p p value xpσn 1 pooled sample standard deviation Fdf factor degrees of freedom SS factor sum of squares MS factor mean squares Edf error degrees of freedom SSe error sum of squares MSe error mean squares Tests 18 6 ...

Page 322: ...confidence level The confidence level changes in accordance with the application 1 Sample Z Interval calculates the confidence interval when the population standard deviation is known 2 Sample Z Interval calculates the confidence interval when the population standard deviations of two samples are known 1 Prop Z Interval calculates the confidence interval when the proportion is not known 2 Prop Z I...

Page 323: ... When the confidence level is 95 for example inputting 0 95 produces 1 0 95 0 05 α Perform the following key operations from the statistical data list 4 INTR 1 Z 1 1 S The following shows the meaning of each item in the case of list data specifica tion Data data type C Level confidence level 0 C Level 1 σ population standard deviation σ 0 List list whose contents you want to use as sample data Fre...

Page 324: ...he difference between two population means when the population standard deviations of two samples are known The following is the confidence interval The value 100 1 α is the confidence level Left o1 o2 Z α 2 Right o1 o2 Z α 2 n1 1 2 σ n2 2 2 σ n1 1 2 σ n2 2 2 σ o1 sample 1 mean o2 sample 2 mean σ1 population standard deviation of sample 1 σ2 population standard deviation of sample 2 n1 sample 1 si...

Page 325: ...sample 1 size positive integer o2 sample 2 mean n2 sample 2 size positive integer Example To calculate the 2 Sample Z Interval when two lists of data are input For this example we will obtain the 2 Sample Z Interval for the data 1 55 54 51 55 53 53 54 53 and data 2 55 5 52 3 51 8 57 2 56 5 when C Level 0 95 95 confidence level σ1 15 5 and σ2 13 5 1 List c a jfw bf fw bd fw 1 List1 c2 List2 c1 1 c ...

Page 326: ...a list 4 INTR 1 Z 3 1 P Data is specified using parameter specification The following shows the meaning of each item C Level confidence level 0 C Level 1 x data 0 or positive integer n sample size positive integer Execute executes a calculation Example To calculate the 1 Prop Z Interval using parameter value specification For this example we will obtain the 1 Prop Z Interval when C Level 0 99 x 55...

Page 327: ...erations from the statistical data list 4 INTR 1 Z 4 2 P Data is specified using parameter specification The following shows the meaning of each item C Level confidence level 0 C Level 1 x1 sample 1 data value x1 0 n1 sample 1 size positive integer x2 sample 2 data value x2 0 n2 sample 2 size positive integer Execute Executes a calculation Example To calculate the 2 Prop Z Interval using parameter...

Page 328: ...idence interval The value 100 1 α is the confidence level Left o tn 1 α 2 Right o tn 1 α 2 x n 1 σ n x n 1 σ n Perform the following key operations from the statistical data list 4 INTR 2 t 1 1 S The following shows the meaning of each item in the case of list data specifica tion Data data type C Level confidence level 0 C Level 1 List list whose contents you want to use as sample data Freq sample...

Page 329: ...population means when both population standard deviations are unknown The t interval is applied to t distribution The following confidence interval applies when pooling is in effect The value 100 1 α is the confidence level Left o1 o2 t α 2 Right o1 o2 t α 2 n1 n2 2 n1 1 n2 1 xp n 1 2 σ n1 n2 2 n1 1 n2 1 xp n 1 2 σ The following confidence interval applies when pooling is not in effect The value 1...

Page 330: ...t whose contents you want to use as sample 2 data Freq1 frequency of sample 1 Freq2 frequency of sample 2 Pooled pooling On or Off Execute executes a calculation The following shows the meaning of parameter data specification items that are different from list data specification o1 sample 1 mean x1σn 1 sample 1 standard deviation x1σn 1 0 n1 sample 1 size positive integer o2 sample 2 mean x2σn 1 s...

Page 331: ...g when C Level 0 95 1 List c a jfw 1 List1 c2 List2 c1 1 c 1 1 c2 Off c1 CALC Left interval lower limit left edge Right interval upper limit right edge df degrees of freedom o1 sample 1 mean o2 sample 2 mean x1σn 1 sample 1 standard deviation x2σn 1 sample 2 standard deviation n1 sample 1 size n2 sample 2 size The following item is also shown when Pooled On xpσn 1 pooled sample standard deviation ...

Page 332: ...and normal distribution is used to estimate the proportion of the products will reach this value Normal probability density calculates the probability density of normal distribu tion from a specified x value Normal distribution probability calculates the probability of normal distribution data falling between two specific values Inverse cumulative normal distribution calculates a value that repres...

Page 333: ... standard normal distribution πσ 2 f x 1 e 2 2 σ x µ 2 µ σ 0 Perform the following key operations from the statistical data list 5 DIST 1 NORM 1 Npd Data is specified using parameter specification The following shows the meaning of each item x data σ standard deviation σ 0 µ mean Execute executes a calculation or draws a graph Specifying σ 1 and µ 0 specifies standard normal distribution Example T...

Page 334: ...from the statistical data list 5 DIST 1 NORM 2 Ncd Data is specified using parameter specification The following shows the meaning of each item Lower lower boundary Upper upper boundary σ standard deviation σ 0 µ mean Execute executes a calculation Example To calculate the normal distribution probability for a specific parameter value For this example we will calculate the normal distribution prob...

Page 335: ...tatistical data list 5 DIST 1 NORM 3 InvN Data is specified using parameter specification The following shows the meaning of each item Area probability value 0 Area 1 σ standard deviation σ 0 µ mean Execute executes a calculation Example To calculate inverse cumulative normal distribution for a specific parameter value For this example we will determine inverse cumulative normal distribution when ...

Page 336: ... x Γ Γ df π df 1 2 2 df 2 df 1 df 1 x2 Perform the following key operations from the statistical data list 5 DIST 2 t 1 tpd Data is specified using parameter specification The following shows the meaning of each item x data df degrees of freedom df 0 Execute executes a calculation or draws a graph Example To calculate Student t probability density for a specific parameter value For this example we...

Page 337: ...rations from the statistical data list 5 DIST 2 t 2 tcd Data is specified using parameter specification The following shows the meaning of each item Lower lower boundary Upper upper boundary df degrees of freedom df 0 Execute executes a calculation Example To calculate Student t distribution probability for a specific parameter value For this example we will calculate Student t distribution probab...

Page 338: ...alue f x Γ 1 2 df df 2 x e 2 1 df 2 1 x 2 x 0 Perform the following key operations from the statistical data list 5 DIST 3 CHI 1 Cpd Data is specified using parameter specification The following shows the meaning of each item x data df degrees of freedom positive integer Execute executes a calculation or draws a graph Example To calculate χ2 probability density for a specific parameter value For t...

Page 339: ...from the statistical data list 5 DIST 3 CHI 2 Ccd Data is specified using parameter specification The following shows the meaning of each item Lower lower boundary Upper upper boundary df degrees of freedom positive integer Execute executes a calculation Example To calculate χ2 distribution probability for a specific parameter value For this example we will calculate χ2 distribution probability wh...

Page 340: ...key operations from the statistical data list 5 DIST 4 F 1 Fpd Data is specified using parameter specification The following shows the meaning of each item x data n df numerator degrees of freedom positive integer d df denominator degrees of freedom positive integer Execute executes a calculation or draws a graph Example To calculate F probability density for a specific parameter value For this ex...

Page 341: ...boundary Upper upper boundary n df numerator degrees of freedom positive integer d df denominator degrees of freedom positive integer Execute executes a calculation Example To calculate F distribution probability for a specific parameter value For this example we will calculate F distribution probability when lower boundary 0 upper boundary 1 9824 n df 19 and d df 16 aw b jicew bjw bgw 1 CALC prob...

Page 342: ...ion Data data type List list whose contents you want to use as sample data Numtrial number of trials positive integer p success probability 0 p 1 Execute executes a calculation The following shows the meaning of a parameter data specification item that is different from list data specification x integer from 0 to n Example To calculate binomial probability for one list of data For this example we ...

Page 343: ...sample data Numtrial number of trials positive integer p success probability 0 p 1 Execute executes a calculation The following shows the meaning of a parameter data specification item that is different from list data specification x integer from 0 to n Example To calculate binomial cumulative probability for one list of data For this example we will calculate binomial cumulative probability for d...

Page 344: ...tatistical data list 5 DIST 6 g 1 POISN 1 Ppd The following shows the meaning of each item when data is specified using list specification Data data type List list whose contents you want to use as sample data µ mean µ 0 Execute executes a calculation The following shows the meaning of a parameter data specification item that is different from list data specification x value Example To calculate P...

Page 345: ...ecute executes a calculation The following shows the meaning of a parameter data specification item that is different from list data specification x value Example To calculate Poisson cumulative probability for one list of data For this example we will calculate Poisson cumulative probability for data 2 3 4 when µ 6 1 List c 1 List1 c gw 1 CALC cumulative probability when x 2 cumulative probabilit...

Page 346: ... specification Data data type List list whose contents you want to use as sample data p success probability 0 p 1 Execute executes a calculation The following shows the meaning of a parameter data specification item that is different from list data specification x value Positive integer number is calculated whether list data Data List or x value Data variable is specified Example To calculate geom...

Page 347: ...ype List list whose contents you want to use as sample data p success probability 0 p 1 Execute executes a calculation The following shows the meaning of a parameter data specification item that is different from list data specification x value Positive integer number is calculated whether list data Data List or x value Data variable is specified Example To calculate geometric cumulative probabili...

Page 348: ...98 ...

Page 349: ...ions 19 2 Simple Interest Calculations 19 3 Compound Interest Calculations 19 4 Investment Appraisal 19 5 Amortization of a Loan 19 6 Conversion between Percentage Interest Rate and Effective Interest Rate 19 7 Cost Selling Price Margin Calculations 19 8 Day Date Calculations ...

Page 350: ...g d displays the same values in reverse sequence Zoom Scroll Sketch and G Solve cannot be used in the Financial Mode In the Financial Mode horizontal lines are blue and vertical lines are red These colors are fixed and cannot be changed The present value is positive when it represents receipt of money and a negative value when it represents a payment Note that calculation results produced in this ...

Page 351: ...whenever you enter the Financial Mode which cancels a Sci number of significant digits or Eng engineering notation setting made in another mode k k k k k Entering the Financial Mode On the Main Menu select the TVM icon to enter the Financial Mode When you do the Financial 1 screen appears on the display Financial 1 screen Financial 2 screen SMPL CMPD CASH AMT CNVT COST DAYS simple interest compoun...

Page 352: ... display the following input screen for simple interest calculation n number of interest periods days I annual interest rate PV principal SI SFV calculates interest principal plus interest Example What would the interest amount and principal plus interest be for a loan of 1 500 borrowed for 90 days at an annual rate of 7 25 Use the 360 day mode and two decimal places In the set up screen specify 3...

Page 353: ...an also press 6 to draw a cash flow graph 6 GRPH The left side is PV while the right side is SI and SFV The upper part of the graph is positive while the bottom part is negative V Window values vary in accordance with simple interest conditions Press J or 6 G T to return to the input screen Press J again to return to the Financial 1 screen Simple Interest Calculations 19 2 ...

Page 354: ...T β PV FV α n log log 1 i 1 i S PMT PVi 1 i S PMT FVi i 1 i n 1 i S 1 i n 1 α 1 i n 1 β F i Formula I 1 i S n 1 i n 1 S 1 1 i n nFV 1 i n 1 i i PMT 1 i S 1 1 i n F i u u u u uFormula II I 0 PV PMT n FV 0 Here PV PMT n FV FV PMT n PV PV present value FV future value PMT payment n number of compound periods I annual interest rate i is calculated using Newton s Method S 1 assumed for beginning of ter...

Page 355: ...Y compounding periods per year When calculating n PV PMT FV The following calculation is performed after conversion from the nominal interest rate to the effective interest rate and the result is used for all subsequent calculations i I 100 When calculating I After I is obtained the following calculation is performed to convert to I I I 1 1 C Y P Y 100 C Y 100 P Y installment periods per year C Y ...

Page 356: ...ected by various calculation conditions Because of this interest calculation results produced by this calculator should be used keeping the above limitation in mind or the results should be verified k k k k k Compound Interest Examples This section shows how compound interest calculations can be used in a variety of applications u u u u uSavings standard compound interest Input Condition Future va...

Page 357: ...xample Calculate the interest rate required to have a 2 500 balance in an installment savings account in two years when 100 is deposited each month and interest is compounded semiannu ally Perform the following key operations from the input screen c bcw Input n 2 12 c aw PV 0 baaw PMT 100 cfaaw FV 2 500 bcw Monthly installment cw Compounding every six months 2 I u u u u uLoans Input Condition Tota...

Page 358: ...nt Formula Representation of Input Condition PV PMT FV do not equal zero PV FV n PMT when FV PV PV FV n PMT when FV PV Example Calculate the interest rate required to repay a 2 500 balance on a loan in two years 24 installments paying back 100 per month and a final 200 installment when interest is com pounded monthly Perform the following key operations from the input screen c bcw Input n 2 12 c c...

Page 359: ...pal Example Calculate the principal required at 5 5 compounded monthly to produce a total of 20 000 in a year Perform the following key operations from the input screen bw Input n 1 f fw I 5 5 c aw PMT 0 caaaaw FV 20 000 bw bcw Monthly compounding 3 PV u u u u uCompound interest rate Example Calculate the interest required compounded monthly to produce a total of 10 000 in 10 years on an initial i...

Page 360: ...ent and then press J Perform the following key operations from the input screen c ew I 4 faaaw PV 5 000 aw PMT 0 baaaaw FV 10 000 bw bcw Monthly compounding 1 n u u u u uInstallment savings Example Calculate to two decimal places the principal plus interest for 250 monthly installments for five years at 6 annual interest compounded monthly Calculate amounts for when installments are made at the be...

Page 361: ... u u u uInstallment amount Example Calculate the amount required for each installment to accumulate a total of 10 000 in 5 years at an annual interest rate of 6 compounded semiannually In the set up screen specify End for Payment Norm1 for Display and then press J Perform the following key operations from the input screen f bcw Input n 5 12 gw I 6 0 aw PV 0 c baaaaw FV 10 000 bcw Monthly installme...

Page 362: ...late a total of 10 000 in 10 years with 60 monthly installments In the set up screen specify End for Payment and then press J Perform the following key operations from the input screen ba bcw Input n 10 12 c aw PV 0 gaw PMT 60 baaaaw FV 10 000 bcw Monthly installments bw Annual compounding 2 I u u u u uPrincipal plus interest with initial deposit Example Calculate the principal plus interest after...

Page 363: ...hen press J Perform the following key operations from the input screen bf bcw Input n 15 12 h fw c efaw PMT 450 aw FV 0 bcw Monthly installments Monthly compounding 3 PV u u u u uLoan installments Example Calculate the size of the monthly installment for a 25 year 300 000 home loan made at 6 2 compounded semiannually In the set up screen specify End for Payment and then press J Perform the followi...

Page 364: ...0 aw FV 0 bcw Monthly installments Monthly compounding 1 n u u u u uEffective interest rate Example Calculate to two decimal places the effective interest rate compounded monthly on a 25 year 65 000 loan repaid with 460 monthly installments In the set up screen specify End for Payment Fix2 for Display and then press J Perform the following key operations from the input screen cf bcw Input n 25 12 ...

Page 365: ...resented by CF0 The cash flow one year later is shown by CF1 two years later by CF2 and so on Investment appraisal can be used to clearly determine whether an investment is realizing profits that were originally targeted uNPV NPV CF0 1 i CF1 1 i 2 CF2 1 i 3 CF3 1 i n CFn n natural number up to 254 uNFV NFV NPV 1 i n uIRR 0 CF0 1 i CF1 1 i 2 CF2 1 i 3 CF3 1 i n CFn In this formula NPV 0 and the val...

Page 366: ... shown in the table below all revenues realized at the end of the fiscal year What is the net profit or loss of this investment if the useful service life of the machine is six years the resale value after six years is 14 000 and the capital cost is 11 Year Revenues 1 5 000 2 42 000 3 31 000 4 24 000 5 23 000 6 12 000 14 000 On the Main Menu select the LIST icon to enter the LIST Mode and perform ...

Page 367: ... look up the following values 6 G T 4 NFV 1 REPT 3 PBP Example An investment of 10 000 in machinery projects the annual revenues shown in the table below all revenues realized at the end of the fiscal year What is the internal rate of return of this investment if the useful service life of the machinery is five years and the resale value after five years is 3 000 Year Revenues 1 2 000 2 2 400 3 2 ...

Page 368: ...ing key operations ee List 3 baaaaw caaaw ceaaw ccaaw caaaw biaa daaaw Return to the Main Menu by pressing m Select the TVM icon to enter the Financial Mode and then press 3 CASH Perform the following key operations from the input screen c 6 List 3 List 3 2 IRR Now you can press 6 to draw a cash flow graph 6 GRPH ...

Page 369: ...est from installment PM1 to payment of installment PM2 ΣINT a b one repayment PMT a INTPM1 I BALPM1 1 i I PMT sign b PRNPM1 PMT BALPM1 1 i c BALPM2 BALPM2 1 PRNPM2 d Σ PRN PRNPM1 PRNPM1 1 PRNPM2 e Σ INT INTPM1 INTPM1 1 INTPM2 PM2 PM1 PM2 PM1 BAL0 PV INT1 0 and PRN1 PMT at beginning of installment term u u u u uConverting between the nominal interest rate and effective interest rate The nominal int...

Page 370: ...ollowing final installment P Y installments per year C Y compoundings per year BAL balance of principal after installment PM2 INT PRN interest principal portion of installment PM1 ΣINT ΣPRN total principal total interest from installment PM1 to payment of installment PM2 Example Calculate the monthly installment due on a 140 000 15 year home mortgage at an annual rate of 6 5 compounded semiannuall...

Page 371: ...rom the input screen bf bcw Input n 15 12 g fw beaaaaw PV 140 000 c aw FV 0 bcw Monthly installments cw Semiannual compounding 4 PMT Pressing 4 AMT displays the amortization input screen Input 24 for PM1 and 49 for PM2 cewejw Calculate PRN 3 PRN 1 REPT 2 INT 1 REPT 1 BAL ...

Page 372: ... 24 to 49 1 REPT 4 ΣINT Calculate ΣPRN 1 REPT 5 ΣPRN Now you can press 6 to draw a cash flow graph 6 GRPH Trace can be activated following the calculation Pressing e displays INT and PRN when n 1 Each subsequent press of e displays INT and PRN for n 2 n 3 and so on ...

Page 373: ...version k k k k k Converting the Annual Percentage Rate APR to the Effective Interest Rate EFF EFF n APR 100 1 1 100 n Example Calculate to two decimal places the effective interest rate for an account paying an interest rate of 12 compounded quarterly In the set up screen specify Fix2 for Display and then press J Perform the following key operations from the input screen ew n 4 bcw I 12 1 EFF The...

Page 374: ... of 12 55 compounded quarterly In the set up screen specify Norm1 for Display and then press J Perform the following key operations from the input screen ew n 4 bc ffw I 12 55 2 APR The obtained value is assigned to I P 6 19 6 Conversion between Percentage Interest Rate and Effective Interest Rate ...

Page 375: ...MAR SEL CST 1 100 Press 1 COST from the initial screen 2 to display the following input screen Cst cost Sel selling price Mrg margin COST SEL MRG calculates cost selling price margin k k k k k Cost Example Calculate the cost for a selling price of 2 000 and a margin of 15 Perform the following key operations from the input screen c caaaw Sel 2 000 bfw Mrg 15 1 COST ...

Page 376: ...following key operations from the input screen bcaaw Cst 1 200 c efw Mrg 45 2 SEL k k k k k Margin Example Calculate the margin for a selling price of 2 500 and a cost of 1 250 Perform the following key operations from the input screen bcfaw Cst 1 250 cfaaw Sel 2 500 3 MRG 19 7 Cost Selling Price Margin Calculations ...

Page 377: ...ulations Day date calculations are also performed in accordance with the current setting for number of days in the year but the following calculations cannot be performed when the 360 day year is set Attempting to do so causes an error Date Number of Days Date Number of Days The allowable calculation range is January 1 1901 to December 31 2099 The format for inputting a date is month day year Two ...

Page 378: ...following key operations from the input screen g abbjjhw d1 June 1 1997 c d2 Any date baaaw 2 d1 D d D future date calculation Example To determine the date that is 1 000 days before January 1 2001 using a 365 day year Note that the attempting to perform the following calculation while the 360 day year is in effect causes an error Perform the following key operations from the input screen b abcaab...

Page 379: ...r of Bytes Used by a Program 20 5 Secret Function 20 6 Searching for a File 20 7 Searching for Data Inside a Program 20 8 Editing File Names and Program Contents 20 9 Deleting a Program 20 10 Useful Program Commands 20 11 Command Reference 20 12 Text Display 20 13 Using Calculator Functions in Programs Chapter 20 ...

Page 380: ...DEL A specific program all program delete P 362 SRC REN file name search change LOAD loads a built in Program Library program See the separate Software Library Manual for details except fx 9750G PLUS CFX 9850G PLUS The following models do not support the LOAD command fx 9750G PLUS CFX 9850G PLUS If there are not programs stored in memory when you enter the PRGM Mode the message No Programs appears...

Page 381: ...er the file name and then input the actual program u u u u uTo register a file name Example To register the file name OCTA Note that a file name can be up to eight characters long 1 Display the program list menu and press 3 NEW to display a menu which contains the following items RUN BASE general calculation number base program input P 360 Q Q Q Q Q password registration SYBL symbol menu 2 Input t...

Page 382: ... registering a file name press J When you register the name of a program that contains binary octal decimal or hexadecimal calculations the indicator B is appended to the right of the file name u u u u uTo input a program The following items are included in the function menu of the program input screen which is used for program input P 365 TOP BTM top bottom of program P 364 SRC search MENU mode m...

Page 383: ...Area S c 9d value of A xw Volume V 9c d value of A Mdw You could also perform this calculation by assigning the value for the length of one side to variable A Length of One Side A value of A aaAw Surface Area S c 9d aAxw Volume V 9c d aAMdw If you simply input the manual calculations shown above however the calculator would execute them from beginning to end without stopping The following commands...

Page 384: ... f and c to highlight the name of the program you want to run 2 Press 1 EXE or w to run the program Let s try running the program we input above Length of One Side A Surface Area S Volume V 7 cm 169 7409791 cm2 161 6917506 cm3 10 cm 346 4101615 cm2 471 4045208 cm3 15 cm 779 4228634 cm2 1590 990258 cm3 1 EXE or w hw Value of A Intermediate result produced by ww baw 20 2 Programming Examples ...

Page 385: ...inal result is on the display re executes the program P 378 You can also run a program while in the RUN Mode by inputting Prog file name w An error occurs if the program specified by Prog file name cannot be found Programming Examples 20 2 ...

Page 386: ...n below appears whenever something illegal occurs during program execution When such a message appears press d or e to display the location where the P 436 error was generated along with the cursor Check the Error Message Table for steps you should take to correct the situation P 360 Note that pressing d or e will not display the location of the error if the program is password protected u u u u u...

Page 387: ... Examples of 1 byte commands sin cos tan log A B C 1 2 etc Examples of 2 byte commands Lbl 1 Goto 2 etc While the cursor is located inside of a program each press of d or e causes the cursor to move one byte You can check how much memory has been used and how much remains at any time by selecting the MEM icon in the Main Menu and entering the MEM P 24 Mode See Memory Status MEM for details ...

Page 388: ... CASIO P 353 The password input procedure is identical to that used for file name input 3 Press w to register the file name and password Now you can input the contents of the program file Registration of a password uses 16 bytes of memory Pressing w without inputting a password registers the file name only without a password 4 After inputting the program press Q to exit the program file and return...

Page 389: ...361 2 Press 2 EDIT 3 Input the password and press w to recall the program The message Mismatch appears if you input the wrong password Secret Function 20 5 ...

Page 390: ...e search Example To use file name search to recall the program named OCTA 1 While the program list is on the display press 3 NEW and input the name of the file you want to find P 360 If the file you are looking for is password protected you should also input the password 3 NEW OCTA 2 Press w to recall the program If there is no program whose file name matches the one you input a new file is create...

Page 391: ...there is no program whose file name starts with the characters you input the message Not Found appears on the display If this happens press J to clear the error message 3 Use f and c to highlight the file name of the program you want to recall and then press 2 EDIT to recall it Searching for a File 20 6 ...

Page 392: ... match inside the program for the data you specified the contents of the program appear with the cursor located at the point from which you started your search Once the contents of the program are on the screen you can use the cursor keys to move the cursor to another location before searching for the next instance of the data Only the part of the program starting from the current cursor location ...

Page 393: ...llowing two operations to correct the situation Press e or d to clear the error and return to the file name input screen Press A to clear the new file name and input a new one u u u u uTo edit program contents 1 Find the file name of the program you want in the program list 2 Recall the program The procedures you use for editing program contents are identical to those P 20 used for editing manual ...

Page 394: ...a S 9d aAx6 g 5 Volume V 9c bc aAMd Compare this with the program for calculating the surface area and volume of a regular octahedron Length of One Side A W4 aaA6 g 5 Surface Area S c 9d aAx6 g 5 Volume V 9c d aAMd As you can see you can produce the TETRA program by making the following changes in the OCTA program Deleting c underlined using a wavy line above Changing d to b c underlined using a s...

Page 395: ...gram Length of One Side A Surface Area S Volume V 7 cm 84 87048957 cm2 40 42293766 cm3 10 cm 173 2050808 cm2 117 8511302 cm3 15 cm 389 7114317 cm2 397 7475644 cm3 1 EXE or w hw Value of A ww baw w Editing File Names and Program Contents 20 8 ...

Page 396: ...gram you want to delete 2 Press 4 DEL 3 Press 1 YES to delete the selected program or 6 NO to abort the operation without deleting anything u u u u uTo delete all programs 1 While the program list is on the display press 5 DEL A 2 Press 1 YES to delete all the programs in the list or 6 NO to abort the operation without deleting anything P 26 You can also delete all programs using the MEM Mode See ...

Page 397: ...on menu items If Then Else I End For To Step Next Whle WEnd Do Lp W If Then Else IfEnd For To Step Next While WhileEnd Do LpWhile command k k k k k CTL program control command menu Selecting CTL from the program menu displays the following function menu items Prog Rtrn Brk Stop Prog Return Break Stop command k k k k k JUMP jump command menu Selecting JUMP from the program menu displays the followi...

Page 398: ...bl Web an Cn Σa Cn an Pl Σa Pl DispR Tbl DrawWeb DrawR Con DrawRΣ Con DrawR Plt DrawRΣ Plt command k k k k k REL conditional jump relational operator commands Selecting REL from the program menu displays the following function menu items G G G G G G relational operators k k k k k I O input output commands Selecting I O from the program menu displays the following function menu items Lcte Gtky Send...

Page 399: ...84 DrawRΣ Con DrawRΣ Plt 384 DrawStat 384 DrawWeb 384 Dsz 380 For To Next 375 For To Step Next 376 Getkey 385 Goto Lbl 380 If Then 373 If Then Else 374 If Then Else IfEnd 375 If Then IfEnd 374 Isz 381 Locate 385 Prog 378 Receive 386 Return 379 Send 387 Stop 379 While WhileEnd 377 Input Command 372 Output Command 372 Multi statement Command 373 _ Carriage Return 373 Jump Code 381 G G G G G Relation...

Page 400: ...uch as AB k k k k k Basic Operation Commands Input Command Function Prompts for input of values for assignment to variables during program execution Syntax variable name Example A _ Description 1 This command momentarily interrupts program execution and prompts for input of a value or expression for assignment to a variable When the input com mand is executed to appears on the display and the calc...

Page 401: ...Description 1 Operation of the carriage return is identical to that of the multi statement command 2 Using a carriage return in place of the multi statement command makes the displayed program easier to read k k k k k Program Commands COM If Then Function The Then statement is executed only when the If condition is true non zero Syntax Parameters condition numeric expression Description 1 The Then...

Page 402: ... whether the If condition is true non zero or false 0 Example If A 0 _ Then A 0 _ IfEnd_ END If Then Else Function The Then statement is executed only when the If condition is true non zero The Else statement is executed when the If condition is false 0 Syntax Parameters condition numeric expression Description 1 The Then statement is executed when the If conditions is true non zero 2 The Else sta...

Page 403: ...ecuted regardless of whether the If condition is true non zero or false 0 Example A _ If A 0 _ Then TRUE _ Else FALSE_ IfEnd_ END For To Next Function This command repeats everything between the For statement and the Next statement The starting value is assigned to the control variable with the first execution and the value of the control variable is incremented by one with each execution Executio...

Page 404: ...For 1 A To 10_ A 3 B_ B Next For To Step Next Function This command repeats everything between the For statement and the Next statement The starting value is assigned to the control variable with the first execution and the value of the control variable is changed according to the step value with each execution Execution continues until the value of the control variable exceeds the ending value Sy...

Page 405: ... commands contained in the loop as long as its condition is true non zero When the condition becomes false 0 execution proceeds from the statement following the LpWhile statement 2 Since the condition comes after the LpWhile statement the condition is tested checked after all of the commands inside the loop are executed Example Do_ A_ A 2 B_ B LpWhile B 10 While WhileEnd Function This command repe...

Page 406: ...ement Do statement and While statement Example While A 0_ If A 2_ Then Break_ IfEnd_ WhileEnd_ A Executed after Break Prog Function This command specifies execution of another program as a subroutine In the RUN Mode this command executes a new program Syntax Prog file name _ Example Prog ABC _ Description 1 Even when this command is located inside of a loop its execution immediately breaks the loo...

Page 407: ... specified by the Prog command does not exist an error occurs 7 In the RUN Mode inputting the Prog command and pressing w launches the program specified by the command Return Function This command returns from a subroutine Syntax Return _ Description Execution of the Return command inside a main routine causes execution of the program to stop Example Prog A Prog B 1 A_ For A B To 10_ Prog B _ B 1 ...

Page 408: ...ement If the current value is zero execution jumps to the statement following the multi statement command display command or carriage return _ Example 10 A 0 C Lbl 1 B B C C Dsz A Goto 1 C 10 This program prompts for input of 10 values and then calculates the average of the input values Goto Lbl Function This command performs an unconditional jump to a specified location Syntax Goto value or varia...

Page 409: ...e by 1 and then jumps if the current value of the variable is zero Syntax Parameters Variable Name A to Z r θ Example Isz A Increments the value assigned to variable A by 1 Description This command increments the value of a control variable by 1 and then tests checks it If the current value is non zero execution continues with the next statement If the current value is zero execution jumps to the ...

Page 410: ...iage return _ Example Lbl 1 A A 0 A Goto 1 With this program inputting a value of zero or greater calculates and displays the square root of the input value Inputting a value less than zero returns to the input prompt without calculating anything k k k k k Clear Commands CLR ClrGraph Function This command clears the graph screen Syntax ClrGraph_ Description This command clears the graph screen dur...

Page 411: ...ation Syntax DrawDyna_ Description This command performs a Dynamic Graph draw operation during program execution in accordance with the drawing conditions defined within the program DrawFTG Con DrawFTG Plt Function These commands graph functions Syntax DrawFTG Con_ DrawFTG Plt_ Description 1 These commands graph functions in accordance with conditions defined within the program 2 DrawFTG Con produ...

Page 412: ...ertical axis and n as the horizontal axis Syntax DrawRΣ Con_ DrawRΣ Plt_ Description 1 These commands graph recursion expressions with Σan Σbn as the vertical axis and n as the horizontal axis in accordance with conditions defined within the program 2 DrawRΣ Con produces a connect type graph while DrawRΣ Plt produces a plot type graph DrawStat Function This draws a statistical graph Syntax DrawSta...

Page 413: ...sed Syntax Getkey_ Description 1 This command returns the code that corresponds to the last key pressed 79 78 68 58 48 77 67 57 47 76 75 66 56 46 36 26 74 64 54 44 73 33 63 53 43 72 32 62 52 42 71 31 61 51 41 65 55 45 35 25 69 59 49 39 29 28 37 38 27 2 A value of zero is returned if no key was pressed prior to executing this command 3 This command can be used inside of a loop Locate Function This ...

Page 414: ... by a value from 1 to 7 while the column is designated by a value from 1 to 21 1 1 21 1 1 7 21 7 Example Cls_ Locate 7 1 CASIO CFX This program displays the text CASIO CFX in the center of the screen In some cases the ClrText command should be executed before running the above program Receive Function This command receives data from an external device Syntax Receive data Description 1 This command...

Page 415: ...side right side variable A to Z r θ numeric constant variable expression such as A 2 relational operator G G G G G Description 1 The following six relational operators can be used in the conditional jump command left side right side true when left side equals right side left side G G G G G right side true when left side does not equal right side left side right side true when left side is greater ...

Page 416: ...n add labels to input prompts and results Program Display X X X X If the text is followed by a calculation formula be sure to insert a display command a carridge return _ or multi statement command between the text and calculation Inputting more than 21 characters causes the text to move down to the next line The screen scrolls automatically if the text causes the screen to become full ...

Page 417: ...of two rows Swap Example 1 To swap the values of Row 2 and Row 3 in the following matrix 1 2 Matrix A 3 4 5 6 The following is the syntax to use for this program Swap A 2 3 Matrix name Executing this program produces the following result MAT Mode u u u u uTo calculate a scalar multiplication Row Example 2 To calculate the product of Row 2 of the matrix in Example 1 and the scalar 4 The following i...

Page 418: ...e following is the syntax to use for this program Row A 2 3 Matrix name Executing this program produces the following result MAT Mode k k k k k Using Graph Functions in a Program P 112 You can incorporate graph functions into a program to draw complex graphs and to overlay graphs on top of each other The following shows various types of syntax you need to use when programming with graph functions ...

Page 419: ...Using Dynamic Graph functions in a program makes it possible to perform repeated Dynamic Graph operations The following shows how to specify the Dynamic Graph range inside a program Dynamic Graph range 1 D Start_ 5 D End_ 1 D pitch_ Example Program ClrGraph_ View Window 5 5 1 5 5 1_ Y Type_ AX 1 Y1_ 1 J41JJ 1 2 D SelOn 1_ 2 451 3 D Var A_ 3 3 1 4 D Start_ 4 J51 5 5 D End_ 5 2 1 6 D pitch_ 6 3 7 Dr...

Page 420: ...e range setting 1 F Start_ 5 F End_ 1 F pitch_ Numeric table generation DispF Tbl_ Graph draw operation Connect type DrawFTG Con_ Plot type DrawFTG Plt_ Example Program ClrGraph_ ClrText_ View Window 0 6 1 2 106 2_ Y Type_ 3X2 2 Y1_ 1 T SelOn 1_ 1 4611 0 2 F Start_ 2 J611 6 3 F End_ 3 2 1 4 F pitch_ 4 3 5 DispF Tbl 5 W6241 6 DrawFTG Con 6 W6242 Executing this program produces the results shown her...

Page 421: ...t an 1 Type_ Specifies recursion type 3an 2 an 1_ 4bn 6 bn 1_ Table range setting 1 R Start_ 5 R End_ 1 a0_ 2 b0_ 1 an Start_ 3 bn Start_ Numeric table generation DispR Tbl_ Graph draw operation Connect type DrawR Con_ DrawRΣ Con_ Plot type DrawR Plt_ DrawRΣ Plt_ Statistical convergence divergence graph WEB graph DrawWeb an 1 10_ Example Program ClrGraph_ View Window 0 1 1 0 1 1_ 1 an 1 Type_ 1 46...

Page 422: ...porate a solve calculation function into a program The following is the syntax for using the Solve function in a program Solve f x n a b Upper limit Lower limit Initial estimated value Example Program 1 Solve 2X2 7X 9 1 0 1 1 K41 In the function f x only X can be used as a variable in expressions Other variables A through Z r θ are treated as constants and the value currently assigned to that vari...

Page 423: ...the graph type See Changing Graph Parameters The following is a typical graph condition specification for a scatter diagram or xyLine graph S Gph1 DrawOn Scatter List1 List2 1 Square Blue _ In the case of an xy line graph replace Scatter in the above specification with xyLine The following is a typical graph condition specification for a normal probability plot S Gph1 DrawOn NPPlot List1 Square Bl...

Page 424: ...tic Regression Quart Logarithmic Regression Log Exponential Regression Exp Power Regression Power The following is a typical graph condition specification for a sine regression graph S Gph1 DrawOn Sinusoidal List1 List2 Blue _ The following is a typical graph condition specification for a logistic regression graph S Gph1 DrawOn Logistic List1 List2 Blue _ Example Program ClrGraph_ 1 S Wind Auto_ 2...

Page 425: ...ta Frequency y axis data YList x axis data XList Regression statistical calculation 1 LinearReg List 1 List 2 List 3 Calculation Frequency data Frequency type y axis data YList x axis data XList 1 41661 Any one of the following can be specified as the calculation type LinearReg linear regression Med MedLine Med Med calculation QuadReg quadratic regression CubicReg cubic regression QuartReg quartic...

Page 426: ...stical calculation SinReg List 1 List 2 Logistic regression statistical calculation LogisticReg List 1 List 2 y axis data YList x axis data XList 20 13 Using Calculator Functions in Programs y axis data YList x axis data XList ...

Page 427: ...the separately available CASIO FA 123 Interface Unit This chapter also contains information on how to use the optional SB 62 cable to connect to a CASIO Label Printer to transfer screen data for printing 21 1 Connecting Two Units 21 2 Connecting the Unit with a Personal Computer 21 3 Connecting the Unit with a CASIO Label Printer 21 4 Before Performing a Data Communication Operation 21 5 Performin...

Page 428: ...u u uTo connect two units 1 Check to make sure that the power of both units is off 2 Remove the covers from the connectors of the two units Be sure you keep the connector covers in a safe place so you can replace them after you finish your data communications 3 Connect the two units using the SB 62 cable SB 62 cable Keep the connectors covered when you are not using them ...

Page 429: ...u uTo connect the unit with a personal computer 1 Check to make sure that the power of the unit and the personal computer is off 2 Connect the FA 123 connection cable to the personal computer 3 Remove the cover from the connector of the unit Be sure you keep the connector cover in a safe place so you can replace it after you finish your data communications 4 Connect the FA 123 connection cable to ...

Page 430: ...pril 2001 u u u u uTo connect the unit with a Label Printer 1 Check to make sure that the power of the unit and the Label Printer is off 2 Connect the optional SB 62 cable to the Label Printer 3 Remove the cover from the connector of the unit Be sure you keep the connector cover in a safe place so you can replace it after you finish your data communications 4 Connect the other end of the SB 62 cab...

Page 431: ...raphic images not sent Monochrome Pressing M sends graphic images in monochrome Color Pressing M sends graphic images in color Do not select Color for Image Set to send data to a Label Printer On Pressing M sends graphic images in monochrome TRAN RECV menu of send settings receive settings IMGE menu of graphic image transfer settings Communication parameters are fixed at the following settings Spe...

Page 432: ...eive starts as soon as data is sent from the sending unit Sending unit To set up the calculator to send data press 1 TRAN while the data communi cation main menu is displayed Press the function key that corresponds to the type of data you want to send SEL selects data items and sends them CRNT selects data items from among previously selected data items and sends them BACK all memory contents incl...

Page 433: ...rogram Program contents Yes Yes Mat n Matrix memory A to Z contents Yes List n List memory 1 to 6 contents Yes File n List file memory 1 to 6 contents Yes Y Data Graph expressions graph write non write status View Window No contents zoom factors G Mem n Graph memory 1 to 6 contents Yes V Win n View Window memory contents No Picture n Picture graph memory 1 to 6 data No DynaMem Dynamic Graph functi...

Page 434: ...put of the password Name of password protected file Password input field 1 2 3 4 5 SYBL symbol input After inputting the password press w u u u u uTo execute a send operation After selecting the data items to send press 6 TRAN A message appears to confirm that you want to execute the send operation YES sends data NO returns to data selection screen Press 1 YES to send the data You can interrupt a ...

Page 435: ... and the back up send menu shown below appears Press 6 TRAN to start the send operation The following shows what the displays of the sending and receiving units look like after the data communication operation is complete Sending Unit Receiving Unit Press A to return to the data communication main menu Data can become corrupted necessitating a RESET of the receiving unit should the connecting cabl...

Page 436: ... Printer equipped with data communications capabilities Selecting Color allows data to be sent to Color Label Printer models only You cannot send the following types of screens to a computer The screen that appears while a data communication operation is in progress A screen that appears while a calculation is in progress The screen that appears following the reset operation The low battery messag...

Page 437: ...cable becomes disconnected if the parameters of the two units do not match or if any other communications problem occurs When this happens press A to clear the error and correct the problem before trying data communications again If data communications are interrupted by A key operation or an error any data successfully received up the interruption will be in the memory of the receiving unit An er...

Page 438: ...410 ...

Page 439: ...ttempting to perform any programming This Program Library is divided into two sections a numeric calculation section and a graphics section Programs in the numeric calculation section produce results only while graphics programs use the entire display area for graphing Also note that calculations within graphics programs do not use the multiplication sign wherever it can be dropped i e in front of...

Page 440: ...program Overview m is divided by 2 and by all successive odd numbers d 3 5 7 9 11 13 to check for divisibility Where d is a prime factor mi mi 1 d is assumed and division is repeated until mi 1 d Example 1 119 7 17 2 440730 2 3 3 5 59 83 3 262701 3 3 17 17 101 Preparation and operation Store the program written on the next page Execute the program as shown below Step Key operation Display Step Key...

Page 441: ...l Lbl Lbl Lbl Lbl R 0 1 2 3 4 6 5 6 7 8 9 M 2 Frac B B A B A F M A I E A A A C 2 B A N C 1 D T 2 2 Goto B B B A Goto A A Goto A C 8 Goto 0 Frac 4 0 2 A 0 Goto Goto A 3 1 1 Goto B 7 A B C D E F G H I J K L M N O P Q R S T U V W X Y Z mi d mi 1 Goto 3 9 Goto B 0 5 No 1 Line Program File name Memory Contents ...

Page 442: ...values are taken as 1010 Overview n0 max a b n1 min a b nk 2 nk nk 2 nk 1 nk 1 k 2 3 If nk 0 then the greatest common measure c will be nk 1 Example 1 2 3 When a 238 a 23345 a 522952 b 374 b 9135 b 3208137866 c 34 c 1015 c 998 Preparation and operation Store the program written on the next page Execute the program as shown below Step Key operation Display Step Key operation Display No 2 ...

Page 443: ...21 22 23 24 25 26 27 C Lbl Abs B A Lbl C B Lbl M 1 A 2 3 N A C 0 A A B F A Goto B Goto C A Abs 2 lnt 3 Goto C B A B 1 T A B 2 A B C Goto B B B A A B C D E F G H I J K L M N O P Q R S T U V W X Y Z a n0 b n1 nk B C No 2 Line Program File name Memory Contents ...

Page 444: ...ata 55 54 51 55 53 53 54 52 is 53 Perform a t test with a level of significance of 5 Preparation and operation Store the program written on the next page Execute the program as shown below No 3 Step Key operation Display Step Key operation Display The above operation produces a t test value of t 53 0 7533708035 According to the t distribution table in the next page a level of significance of 5 and...

Page 445: ... 014 2 009 2 000 1 990 1 980 1 970 1 960 63 657 9 925 5 841 4 604 4 032 3 707 3 499 3 355 3 250 3 169 2 947 2 845 2 787 2 750 2 724 2 704 2 690 2 678 2 660 2 639 2 617 2 596 2 576 0 05 0 01 1 2 3 4 5 6 7 T 5 l Var Lbl Goto 5 4 List 0 x T 0 T 5 1 E 5 M S 5 2 1 M T 4 _ T 5 List xσn 1 _ _ 1 1 M 5 n 5 5 T 3 _ A B C D E F G H I J K L M N O P Q R S T U V W X Y Z m t 5 3 P Probability Degree of Freedom N...

Page 446: ...t the points of tangency and factor zoom is used to enlarge the graph Example To determine m and b for the following values r 1 x 3 y 2 Notes The point plotted for A cannot be moved Even if it is moved on the graph the calculation is performed using the original value An error occurs when r x Be sure to always perform a trace operation whenever you select trace and the message TRACE is on the disp...

Page 447: ...2 6 M M B 0 T E O 2 N M B 5 T E O 1 T Factor N W x2 C X P _ _ R S S 0 _ A _ R S S 0 _ R N G I I B A X A 0 B X A 0 A E N Y R Y x2 A C 1 Z Goto C 1 Z Goto C N N D x2 R C A B A M B E _ 2 A N B E _ 3 E T O _ L _ _ B B 1 P 1 W R E _ x2 M _ Goto N _ Goto _ _ R x2 _ 1 _ R _ 1 _ F x2 R B A Z Goto 0 B A Z Goto 5 x2 A x2 P _ x 1 _ _ x2 Factor A F x2 _ x 1 M _ N _ No 4 Line Program File name ...

Page 448: ...h Y Goto Lbl Graph Y Prog Lbl W 1 C Graph Y Graph Y N 3 9 M Goto 3 E I I C 2 _ _ W 6 _ N N 6 1 R I X X I _ D D C R R Graph Y N O 3 L x2 R C M A A D W E x2 L O 6 X E X W x2 X A _ B B 3 x2 S Prog 1 1 B C _ I 3 Goto R 9 C 1 _ L E 3 No 4 Line Program File name File name ...

Page 449: ...421 1 2 3 4 5 Program for Circle and Tangents No 4 Step Key Operation Display ...

Page 450: ...422 Program for Circle and Tangents No 4 Step Key Operation Display 6 7 8 9 10 ...

Page 451: ...423 11 12 13 14 15 Program for Circle and Tangents No 4 Step Key Operation Display ...

Page 452: ...424 16 17 18 Program for Circle and Tangents No 4 Step Key Operation Display ...

Page 453: ...e the cursor keys to move the pointer around the display To interrupt program execution press A while the graphic screen is on the display The triangle cannot be drawn if the result of the coordinate transformation operation exceeds View Window parameters Preparation and operation Store the program written on the next page Execute the program as shown below A B C D E F G x1 y1 x2 y2 x3 y3 x 1 y 1 ...

Page 454: ...ot Cls O 4 1 Y A 2 Y C 3 Y E 1 A cos sin G cos sin I cos sin K G T 0 X 1 A X 2 C X 3 E _ Plot N Q Q Q Q Q Q Plot A 1 1 B 2 D 3 F A G H J L H C T 4 Y Y Y L B B _ D D F F E Deg Y Y Y B E sin cos sin cos Line sin cos Line Line D 1 _ 1 A B 2 C D 3 E F Q Q Q Q _ Q Q _ 2 _ B _ _ D _ _ F _ Line Deg Plot 2 Plot _ _ _ _ _ _ _ _ _ _ _ _ G H I J K L E C 1 Q D _ 0 Line F View Window Goto 1 8 5 No 5 ...

Page 455: ...427 1 2 3 4 5 Program for Rotating a Figure No 5 Step Key Operation Display ...

Page 456: ...428 6 7 8 9 10 Program for Rotating a Figure No 5 Step Key Operation Display Locate the pointer at X 5 Continue repeating from step 8 ...

Page 457: ...Appendix Appendix A Resetting the Calculator Appendix B Power Supply Appendix C Error Message Table Appendix D Input Ranges Appendix E Specifications ...

Page 458: ...ure to write it down somewhere before performing the RESET operation u u u u uTo reset the calculator F 1 Highlight the MEM icon on the main menu and then press w or press t 2 Use c to move the highlighting down to Reset and then press w 1 2 3 4 5 6 3 Press 1 YES to reset the calculator or 6 NO to abort the operation without resetting anything 4 Press m P 11 If the display appears to dark or dim a...

Page 459: ...button on the back of the calculator This should make the RESET screen appear on the display Perform the procedure to complete the RESET operation Pressing the P button while an internal calculation is being performed will cause all data in memory to be deleted Resetting the Calculator Appendix A P button ...

Page 460: ...quire replacement sooner than the normal expected battery life Warning All memory contents will be deleted if you remove both the main power supply and the memory back up batteries at the same time If you ever remove both batteries correctly reload them and then perform the reset operation k k k k k Replacing Batteries Precautions Incorrectly using batteries can cause them to burst or leak possibl...

Page 461: ...shandling of batteries causes such problems correctly load batteries and then perform the RESET operation to resume normal operation Be sure to replace all four batteries with new ones 1 Press O to turn off the calculator Warning Be sure to turn the calculator off before replacing batteries Replacing batteries with power on will cause data in memory to be deleted 2 Making sure that you do not acci...

Page 462: ...emove the main power supply and the memory back up batteries from the calculator at the same time Be sure to replace the back up power supply battery at least once 2 years regardless of how much you use the calculator during that time Failure to do so can cause data in memory to be deleted 1 Press O to turn off the calculator Warning Be sure to turn the calculator off before replacing batteries Re...

Page 463: ...ry protection battery cover onto the calculator and secure it in place with the screw Next replace the back cover 8 Turn the calculator front side up and remove its case Next press o to turn on power k k k k k About the Auto Power Off Function Calculator power turns off automatically if you do not perform any key operation for about 6 minutes To restore power press o BACK UP ...

Page 464: ... display the point where the error was generated and then correct the program 1234 Check the input numeric value and correct it When using memories check that the numeric values stored in memories are correct 5 Try using a smaller value for Ax x increment decrement 6 Try changing the tolerance tol when using Gauss Kronrod Rule or the number of divisions n when using Simpson s Rule to another value...

Page 465: ...during program data communications Problem with cable connection or parameter setting during data communications Problem with cable connection or parameter setting during data communications Memory of receiving unit became full during program data communications Message Stk ERROR Mem ERROR Arg ERROR Dim ERROR Com ERROR Transmit ERROR Receive ERROR Memory Full Countermeasure Simplify the formulas t...

Page 466: ...0 2n 1 DEG x G G G G G π 2 2n 1 RAD x G G G G G 100 2n 1 GRA Input ranges DEG x 9 109 RAD x 5 107 πrad GRA x 1 1010 grad x 1 x 1 10100 x 230 2585092 x 1 10100 x 5 1099 1 x 5 1099 x 1 1 10 99 x 1 10100 1 10100 x 100 1 10100 x 230 2585092 0 x 1 10100 x 1 1050 x 1 10100 x G G G G G 0 x 1 10100 0 x 69 x is an integer Result 1 10100 n r n and r are integers 0 r n n 1 1010 1 10100 x2 y2 Appendix D Input...

Page 467: ...0 b c x 1 10100 Sexagesimal display x 1 107 x 0 1 10100 ylogx 100 x 0 y 0 x 0 1 y n n is an integer 2n 1 or a fraction However 1 10100 ylog x 100 y 0 x G G G G G 0 1 1 10100 logy 100 x y 0 x 0 1 y 0 x 2n 1 n n G G G G G 0 n is an integer or a fraction However 1 1 10100 log y 100 x Total of integer numerator and denominator must be within 10 digits includes division marks x 1 1050 y 1 1050 n 1 1010...

Page 468: ...0 x 7FFFFFFF 0 positive For a single calculation calculation error is 1 at the 10th digit In the case of exponential display calculation error is 1 at the last significant digit Errors are cumulative in the case of consecutive calculations which can also cause them to become large This is also true of internal consecutive calculations that are performed in the case of xy x y x 3 x nPr nCr etc In t...

Page 469: ... hours continuous display of main menu 200 hours continuous operation 5 minutes calculation 55 minutes display Main CFX 9850G PLUS CFX 9850GB PLUS CFX 9850GC PLUS CFX 9950GB PLUS LR03 AM4 320 hours continuous display of main menu 280 hours continuous operation 5 minutes calculation 55 minutes display R03 UM 4 180 hours continuous display of main menu 160 hours continuous operation 5 minutes calcul...

Page 470: ...ion memory data matrix memory data list data variable data Table Graph data graph functions equation calculation coefficients Method Start stop asynchronous half duplex Transmission speed BPS 9600 bits second Parity none Bit length 8 bits Stop bit Send 3 bits Receive 2 bits X ON X OFF Control None ...

Page 471: ... 259 Bug 358 Built in function 123 194 C Calculation execution indicator 10 Calculation priority sequence 16 Carriage return 373 Cell 233 Center 200 Central difference 56 Chi square distribution 310 Clear commands 382 Coefficient of determination 261 Color tint 11 Combination 48 Comment text 164 Communications parameter 403 Complex numbers 67 Compound interest calculations 326 Conditional jump rel...

Page 472: ...Mode 182 Dynamic graph 181 Dynamic graph locus 7 188 Dynamic graph type 7 186 E Editing calculations 20 Editing list values 233 Effective interest rate 336 345 Ellipse 197 Eng 15 Engineering notation 15 44 50 EQUA Mode 100 Error message 436 Errors 19 Estimated values 272 Exponential display 9 15 37 Exponential function 46 Exponential regression graph 263 F F distribution 312 F Test 277 290 Factor ...

Page 473: ...nction 137 Integer part 96 Integral 150 Integration calculation 6 60 Integration graph 127 Interest rate 334 Inverse hyperbolic function 46 Inverse trigonometric function 45 Investment appraisal 337 J Jump commands 380 K Key markings 2 L Latus rectum 200 Line graph color 6 Line menu 160 Line normal to a curve 156 Linear equations with two to six unknowns 101 Linear recursion between three terms 21...

Page 474: ...peration 17 Multi statement command 373 Multistatements 41 N Negation 78 Newton s method 108 328 Norm 15 37 Normal distribution 305 Normal distribution curve 258 Normal probability graphing 275 Normal probability plot 255 Normal probability distribution calculations 273 Normalized variate 273 Not 78 Number of bytes 359 Number of days per year setting 7 324 349 Number system 76 Numeric calculations...

Page 475: ...ational operator 370 Replacing batteries 432 Replay function 40 RESET operation 12 430 Residual calculation 6 267 Root 145 Row swapping 83 RUN Mode 4 S Sample standard deviation 259 Savings 328 331 Scalar multiplication 93 Scatter diagram 251 Sci 15 Scroll 130 Secret function 360 Selling price 348 Sequence 218 Set up screen 4 Sexagesimal operations 44 Sexagesimal values 10 Significant digits 15 36...

Page 476: ...Text display 20 388 Third quartile 260 Trace 128 Trigonometric function 45 TVM Mode 323 Type A functions 16 Type B functions 16 V Variable 22 38 Variable data VARS menu 28 Vertex 197 View Window 113 W WEB graph 225 Whiskers 257 X X constant expression 118 Xnor 78 Xor 78 xy line graph 255 Y y intercepts 147 Z Z confidence interval 295 Z Test 276 277 Zoom 132 Index ...

Page 477: ...wRΣ Plt 384 DrawStat 384 DrawWeb 384 Dsz 380 For To Next 375 For To Step Next 376 Getkey 385 Goto Lbl 380 If Then 373 If Then Else 374 If Then Else IfEnd 375 If Then IfEnd 374 Isz 381 Locate 385 Prog 378 Receive 386 Return 379 Send 387 Stop 379 While WhileEnd 377 Input Command 372 Output Command 372 Multi statement Command 373 _ Carriage Return 373 Jump Code 381 G G G G G Relational Operators 387 ...

Page 478: ...enu Displays program command menu SET UP m Returns to the Main Menu Shows the set up display A LOCK a Allows entry of alphanumeric characters shown in red Locks Unlocks entry of alphanumeric characters r x x Press after entering value to calculate square Press before entering value to calculate square root Enters character r θ M Press between two values to make second value exponent of first Press...

Page 479: ...ng value to calculate inverse cosine Enters letter E t Press before entering value to calculate tangent Press before entering value to calculate inverse tangent Enters letter F d c G Press between entering fraction values Converts fraction to decimal Displays improper fractions Enters letter G H M Converts a fraction to a decimal value or a decimal value to a fraction Sends a shot of the current s...

Page 480: ...se curly bracket Enters letter T U b Enters number 1 Enters letter U V c Enters number 2 Enters letter V W d Enters number 3 Enters letter W X Addition function Specifies positive value Enters open bracket Enters letter X Y Subtraction function Specifies negative value Enters close bracket Enters letter Y Z a Enters number 0 Enters letter Z SPACE Enters decimal point Enters character Enters a blan...

Page 481: ...d Pitch Reslt FORM RANG Reslt S Rlt S Cof P Rlt P Cof n I PV PMT FV P Y C Y Level3 min max scal min max scal min max ptch min max scal min max scal min max ptch n x Σx Σx2 xσn xσn 1 minX maxX y Σy Σy2 Σxy yσn yσn 1 minY maxY a b c d e r Q1 Med Q3 Mod Strt Pitch x1 y1 x2 y2 x3 y3 n x xσn 1 n1 n2 x1 x2 x1σ x2σ xpσ F Fdf SS MS Edf SSe MSe p z t Chi F Left Right p p 1 p 2 df s r r2 an an 1 an 2 bn bn ...

Page 482: ... GRPH DYNA TABL RECR Level2 DRAW GRPH LIST MARK COLR CALC Swap Rw Rw Rw Srt A Srt D SEL TYPE COLR GMEM On Off Var TYPE On Off TYPE Blue Orng Grn SEL C SEL TYPE n an Level3 On Off GPH1 GPH2 GPH3 Scat xy Hist Box Box N Dis Brkn X Med X 2 X 3 X 4 Log Exp Pwr Sin NPP Lgst List1 List2 List3 List4 List5 List6 Blue Orng Grn 1VAR 2VAR X Med X 2 X 3 X 4 Log Exp Pwr Sin Lgst On Off Y r Parm X c Y Y Y Y Blue...

Page 483: ...Rec m n p f k M G T P E Sto Rcl fn And Or Not Level3 f1 f2 f3 f4 f5 f6 Command List_ List Mat Dim_ Fill Seq Min Max Mean Median Sum_ Prod_ Cuml_ Percent_ AList_ Mat_ Mat List Det_ Trn_ Augment Identity_ Dim_ Fill i Abs_ Arg_ Conjg_ ReP_ ImP_ Solve d dx d2 dx2 FMin FMax Σ x y Orange_ Green_ sinh_ cosh_ tanh_ sinh 1 _ cosh 1_ tanh 1 _ P C Ran P Q R t Abs_ Int_ Frac_ Rnd Intg_ r g Pol Rec m n p f k M...

Page 484: ...456 ...

Page 485: ...ment into an outlet on a circuit different from that to which the receiver is connected Consult the dealer or an experienced radio TV technician for help FCC WARNING Changes or modifications not expressly approved by the party responsible for compliance could void the user s authority to operate the equipment Proper connectors must be used for connection to host computer and or peripherals in orde...

Page 486: ...CASIO COMPUTER CO LTD 6 2 Hon machi 1 chome Shibuya ku Tokyo 151 8543 Japan G355 21 G356 21 G357 21 G359 21 ...

Reviews: