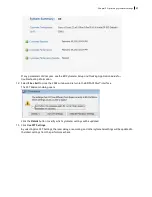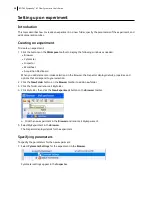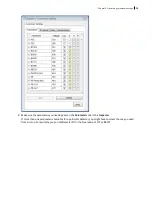
3. Set the current tube pointer to
Beads_001
.
4. Click
Acquire Data
in the
Acquisition Dashboard
to begin acquisition.
5. While data is being acquired:
a. Draw a gate around the singlets on the FSC vs SSC plot.
b. Rename the P1 gate to
Singlets
.
c. Use the
Inspector
to set the other plots to show only the singlet population by selecting the Singlets
checkbox.
6. Click
Record Data.
7. When event recording has completed, remove the first tube from the cytometer.
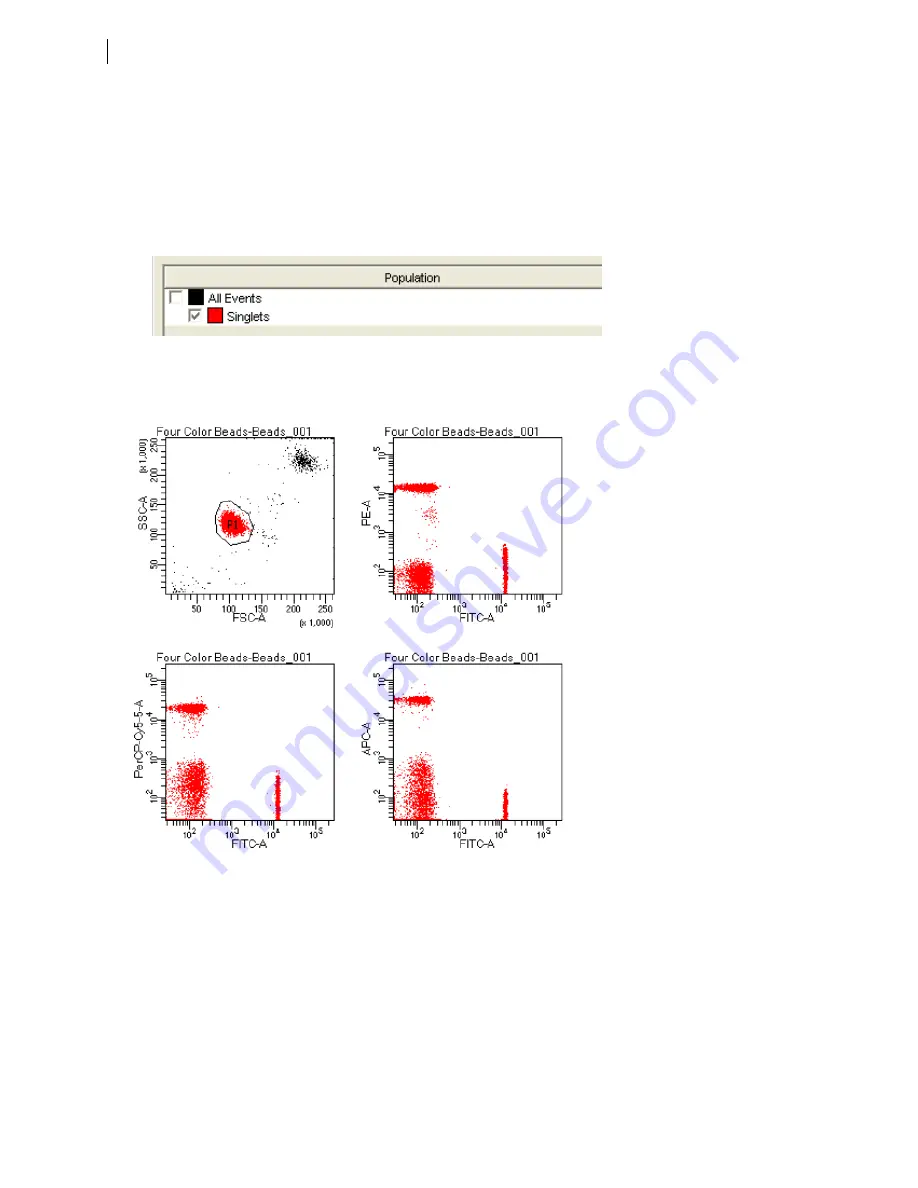
The
MyData
worksheet plots should look like the following.
8. Install the second sample tube onto the SIP.
9. Set the current tube pointer to
Beads_002
.
10. Click
Acquire Data
to begin acquisition.
11. Before recording, preview the data on the
MyData
worksheet to verify that all expected populations are
visible and the data is similar to the previous sample.
12. Click
Record Data.
13. When event recording has completed, remove the second tube from the cytometer.
14. If you are recording more than two tubes, repeat steps 8 through 13 for the remaining tubes.
70
BD FACSymphony™ A1 Flow Cytometer User's Guide
Summary of Contents for FACSymphony A1 Flow
Page 1: ...FACSymphony A1 Flow Cytometer User s Guide 23 23437 01 2022 07 For Research Use Only ...
Page 6: ......
Page 10: ...This page intentionally left blank ...
Page 24: ...This page intentionally left blank ...
Page 36: ...This page intentionally left blank ...
Page 50: ...This page intentionally left blank ...
Page 87: ...More information l Running a performance check page 55 Chapter 7 Technical overview 87 ...
Page 88: ...This page intentionally left blank ...
Page 96: ...This page intentionally left blank ...


