Diagnostics
Document No. D113-015
Page 51 of 77
Revision 1.9
The Status monitoring window can be opened by either double-clicking on the
Status
item in
the Project Explorer tree, or by right-clicking on the module and selecting
Status
.
The status window contains multiple tabs to display the current status of the module. Most
of these parameters in the status windows are self-explanatory or have been discussed in
previous sections.
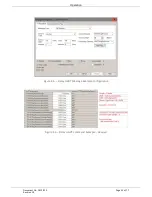
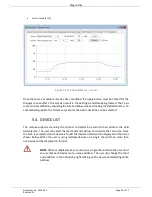
Figure 5.4. - Status monitoring – General
The General tab displays the following general parameters and can also be used to set the
module time to the PC time:
Parameter
Description
Protocol
Indicates the current configured protocol:
EtherNet/IP
DNP3 TCP
DNP3 UDP
Modbus TCP
Owned
Indicates whether or not the module is currently owned (Class 1)
by a Logix controller.
Up Time
Indicates the elapsed time since the module was powered-up.
MAC Address
Displays the module’s unique Ethernet MAC address.
Temperature
The internal temperature of the module.
Processor Scan
The amount of time (microseconds) taken by the module’s
processor in the last scan.


