8.1.7 Results > Graph
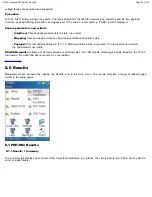
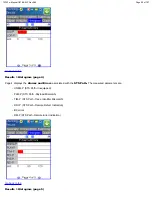
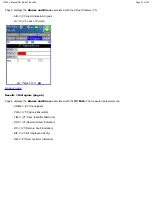
The Graph tab brings up the screen displaying a log of the Errors recorded during the measurement interval. A dedicated page is
available for each errors type. Scroll through the various pages to display the anomaly of interest.
A graphical timeline on the horizontal axis indicates when the event occurred while the vertical axis indicates the logarithmic
scale of errors. The upper left and right arrows allow the user to scroll through the measurement period while the + and – keys
allow zooming of the time axis.
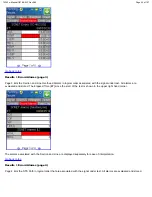
A View status screen can be accessed by tapping on the result area. A start and finish time including count of the event type will
be displayed. The View status screen is shown below.
TX150 e-Manual D07-00-023 Rev A02
Page 39 of 107


