Real Time Displays
Calls in Queue Graph (Insight CTX Plus Only)
16
Insight CTX Supervisor Guide 04/03
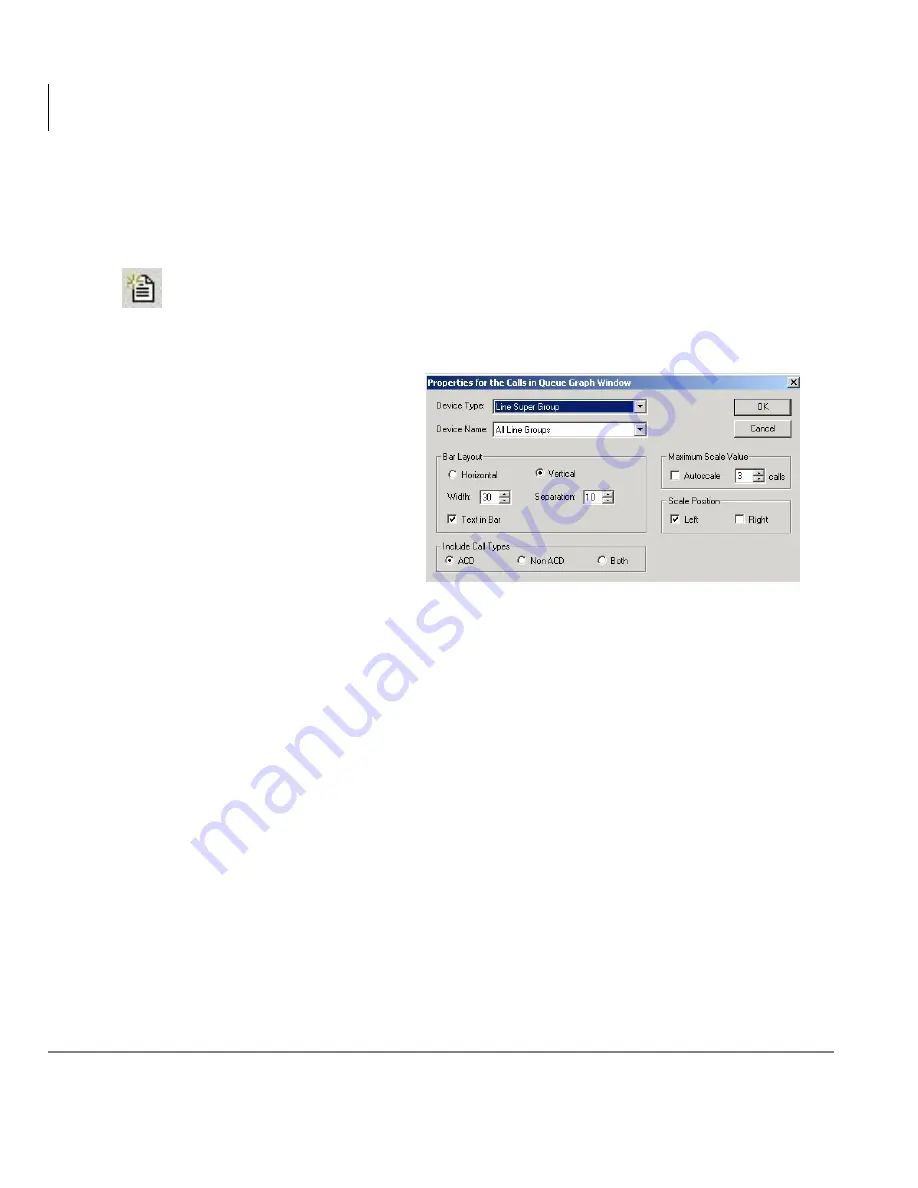
Configuring Calls in Queue Graph
You can configure the Calls in Queue Graph properties: orient the bar horizontally or
vertically, set the bar width, bar separation, set text in the bar, and scale the bar.
1. Select the New Real Time Window icon. The New Real Time Window
displays.
2. From the New Real Time window, select Calls in Queue Graph from the
drop-down list and click OK.
3. Right click on the Calls
in Queue Graph
Window that you wish
to configure and select
Properties.
4. From the Properties for the Calls in Queue Window, select the Name of the
Device whose members you wish to monitor.
For example, if you select DID Group, you can monitor the DID numbers
belonging to the selected group. Whereas, if you choose DID Super Group
you can monitor DID Groups within the selected Super Group.
5. Select the graph orientation (horizontal or vertical).
6. Enter a bar Width (in pixels).
7. Enter a bar Separation (spacing between bars in pixels).
8. Check the Text In Bar box to display text labels within the bars.
If you choose text in bar, the label size is governed by the bar size. If you
choose text outside the bar, the label size is governed by the bar spacing.
9. Either check the Autoscale box or enter the maximum number of calls you
wish the queue graph to display.
10. Choose the axis position (Top/Left, Bottom/Right, or both).
11. Click OK.
68
12
Содержание Strata CTX Insight CTX
Страница 4: ......
Страница 8: ...Contents Chapter 5 Alarms iv Insight CTX Supervisor Guide 04 03 ...
Страница 12: ...Introduction Related Documents and Media viii Insight CTX Supervisor Guide 04 03 ...
Страница 74: ...Reports Using MIS Reports to Improve Performance 62 Insight CTX Supervisor Guide 04 03 ...
Страница 92: ...Alarms View Alarms 80 Insight CTX Supervisor Guide 04 03 ...
Страница 104: ...Glossary Report Terminology 92 Insight CTX Supervisor Guide 04 03 ...


