Micro-Master Touch User Guide
130
© 2014 Toro Australia Pty Ltd
Ver 1.2, June 2014
18.7
Log View
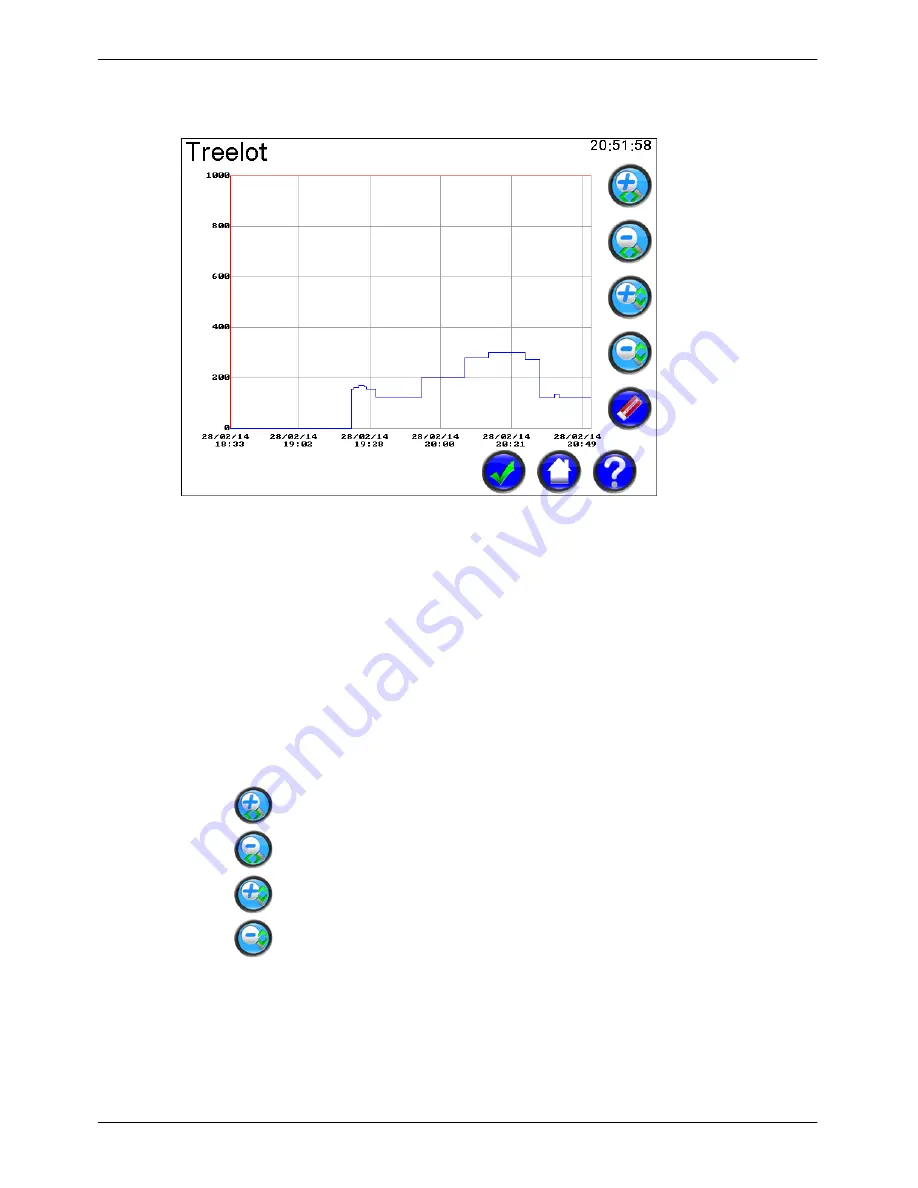
Figure 98 - Log View Screen
Log
Depending on the log selected for display, a graph of the parameter is shown. For example, in the
log graph above, the flow for Flow Meter Treelot is shown. Initially, the graph for the last 24 hours is
shown, but the view can be zoomed using the controls in the action area of the screen. Clicking on
the top, bottom, left or right sections of the graph will pan up, down, left and right respectively.
Depending on the time scale on the time axis, either the date or time will be displayed at six points on
the axis.
Note that the time axis may not be continuous. In the example above, if the Treelot Flow Meter is
disabled for a period of time, there is no gap in the graph for that time period.
Zoom Controls
This controls zooms in on the log in the time axis. The zoom is centered around
the middle point of the time axis.
This controls zooms out on the log in the time axis. The zoom is centered around
the middle point of the time axis.
This controls zooms in on the log in the value (y) axis. The zoom is centered
around the middle point of the value axis.
This controls zooms out on the log in the value (y) axis. The zoom is centered
around the middle point of the value axis.