Demo file without instrument
Example
Load the
“D1”
file from the
“Sample files”
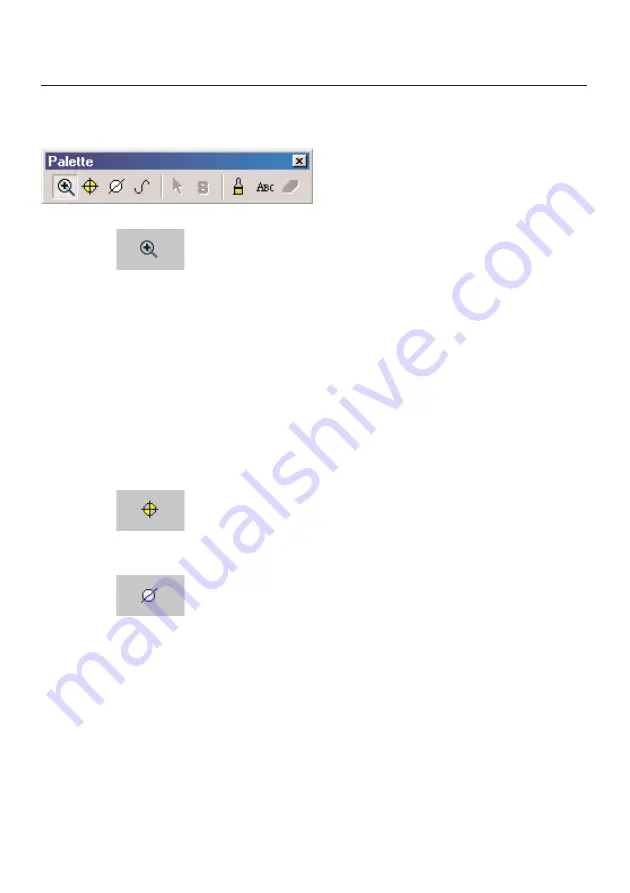
folder and then play around with the toolbar
palette in diagram:
Zoom
Zooms sections
The limits for the area to be shown are set by drawing a rectangle
in the diagram window (keep left mouse button pressed inside
window). This function can also be carried out during an online
measurement. The selected section always shows the current
value.
The diagram is returned to its normal size by clicking on
“Actual
size”
. All of the section zooms are then undone.
“Crosshair”
Select a measurement curve to demonstrate a crosshair, which
follows the curve. The reading number, date, time and reading
are also shown in a window.
“Mark section”
Selective statistics.
You can determine the section in diagrams, which is to be
calculated or saved:
Click on the left of a curve to determine the section to be
calculated, you can move the section limits using the left mouse
button and the complete window using the right mouse button.
24
Содержание 300 XXL
Страница 1: ...Comfort Software Professional Analysis software testo 300XXL Instruction manual en...
Страница 2: ...2...
Страница 23: ...23 Histogram Digit box Form only in VAC module Demo file without instrument Example...
Страница 63: ...63 Main menu item File Details Background Example of printout diagram...
Страница 78: ......
Страница 79: ......


