


P
RINTING
AND
E
XPORTING
FROM
THE
A
NALYZER
S
CREENS
.............................
Sievers M500e TOC Analyzer
Operation and Maintenance Manual
DLM 78510-02 EN Rev. B
123
SUEZ © 2022
message. (For more information on the toolbar, see
.)
The
Home
screen also includes a section showing the active Analyzer mode (Protocol),
along with its status (
Initializing
,
Analyzing
, and so on) and the time remaining until the
next measurement. To modify the default Analyzer mode, see
Additionally, the
Active I/O
settings and consumables usage (% used) indicators (UV
Lamp, Pump Heads, and Resin Cartridge) appear on the
Home
screen.
To change the display of data on the trend graph
Use this procedure to change the background color and the size of the data points
on the trend graph. The changes to the trend graph appear on both the
Home
h
screen and the
Online Data
tab of the
Data
D
screen. You can also change the
time range on the X axis of the trend graph on the
Home
h
screen. (The trend
graph on the
Online Data
tab of the
Data
D
screen has its own options for setting
the time range on the X axis.)
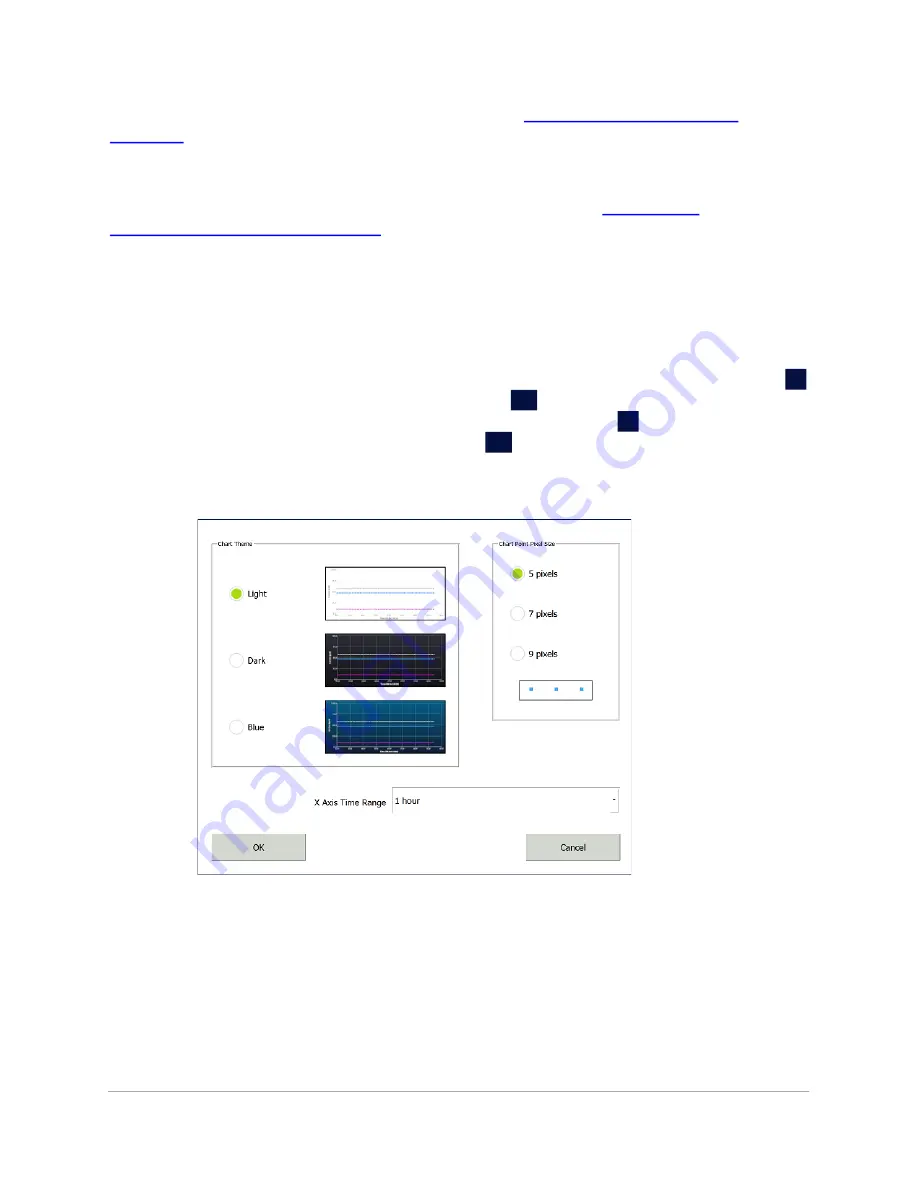
1. Click anywhere on the trend graph. A
Chart
dialog box appears.
2.
To change the color of the trend graph background, select a chart theme:
Light
(white background),
Dark
(black background), or
Blue
(blue background).
3.
To change the size of the data points on the trend graph, select
5 pixels,
7 pixels,
or
9 pixels
. When you make a selection, the size of the three data
points in the rectangular box changes to match the selection.
4.
To change the time range on the trend graph, click within the
X Axis Time
Range
field and select a value:
1 hour, 4 hours, 8 hours, 12 hours, 1 day,
3 days,
or
1 week.


