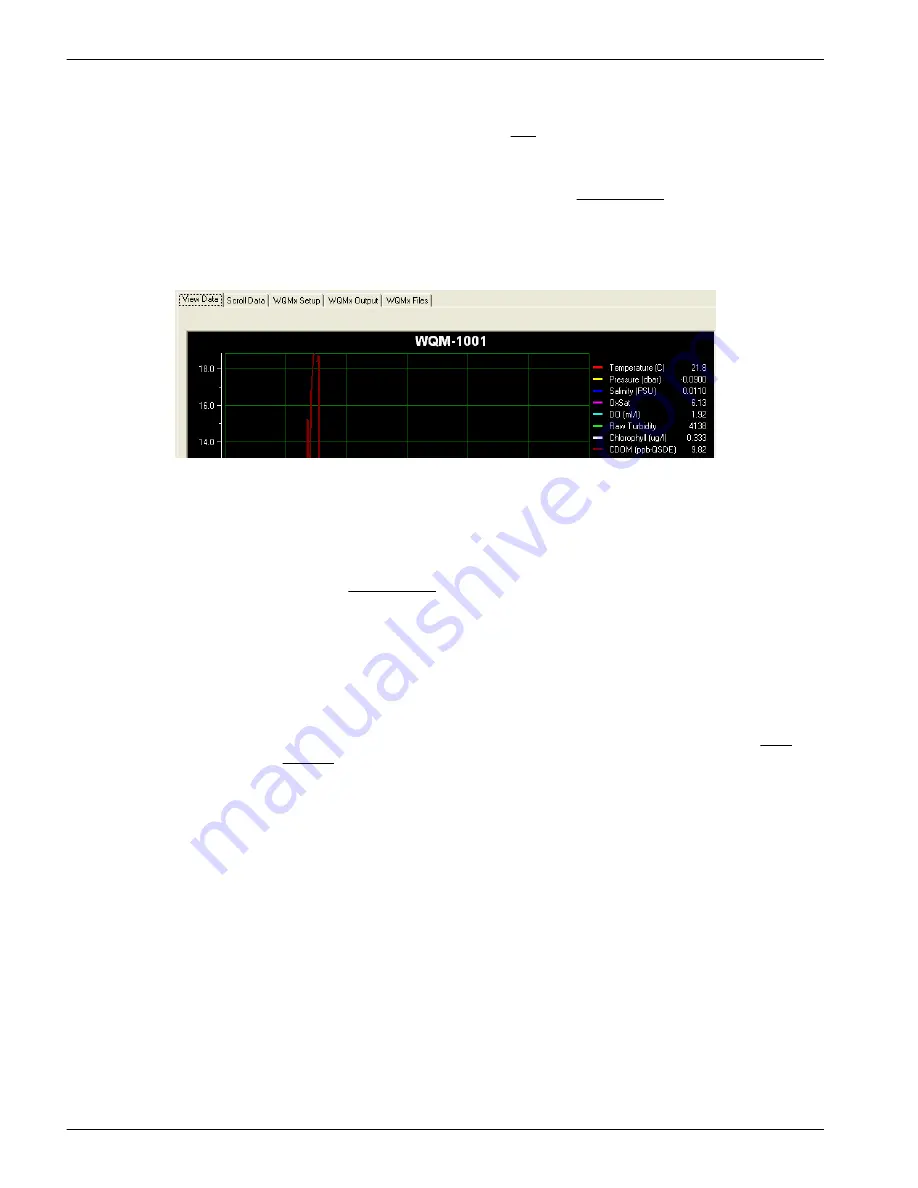
Temperature, Pressure, DO, Turbidity, Chlorophyll and CDOM show in the
View Data
tab.
2.
Select different checkboxes under the Plot heading to see different parameters in the
View Data
tab.
3.
Start the sensor.
4.
Monitor the data in the
View Data
tab and in the Data Sidebar area.
2.2.3 View data tab
Monitor the collected data in real-time.
1.
Go to the
View Data
tab.
2.
The user can change the parameters that show in the plot area of
View Data
tab.
a.
Put the sensor in
In Standby
.
b.
Go to the
WQMx Output
tab.
c.
Select the check boxes for the parameters to be stored in the sensor.
d.
Push
Send Output Configuration
.
e.
Go to the Data Sidebar area and select the parameters to show in the
View Data
graph area.
2.3 Stop sensor
Stop the sensor to finish the functional check.
1.
Push
Stop WQM Sample
.
a.
No more data is collected on the
View Data
and
Scroll Data
tabs, or the Data
Sidebar area.
b.
The Bio-wiper closes on the WQM. The wiper does not move on the WQMx.
c.
The
Scroll Data
tab shows "status records" that start with "WETS" at 1 Hz.
d.
The sensor is in
In Standby
.
2.
Turn off the power supply.
3.
Disconnect the sensor from the power supply and the PC.
Functional check
8
Содержание WQM Series
Страница 2: ......
Страница 49: ...Section 6 General information Revised editions of this user manual are on the manufacturer s website 47 ...
Страница 53: ......


