R5
SUPREME - Navigation System
OPERATION
7000 118-301, A
Page 93
1. Enter the
Tide Plot
view by pressing
Main Menu
Voyage
Tide
2.
Click on the button ―Select Location‖ to enter the
Port List
view.
3.
Select the desired port in the port list and click on the button ―Use Port‖. The
Tide Plot
view is shown with a graphical prediction for the current day or a
previously selected date.
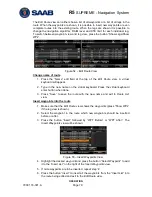
Figure 75
– Tide Plot
The
Tide Plot
shows the predicted tides for the selected port and date. The port id and
the port name are shown above the plot. The plot date is shown in the upper right
corner. The orange dot in the plot marks the current time as derived from the GPS. The
blue dot marks the time that is selected by the user. It is possible to click anywhere in
the plot to move the blue dot or to click on the buttons ―
Select Previous H/L
‖ and
―
Select Next H/L
‖ to step between local high and local low points in the plot. It is also
possible to move the marker with the
ARROW KEYPAD
button on the front of the R5
SUPREME CDU. Use the arrows to mark the plot and press
ENTER
. When the plot is
selected the left and right arrow buttons can be used to move the blue dot.
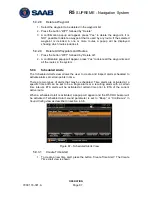
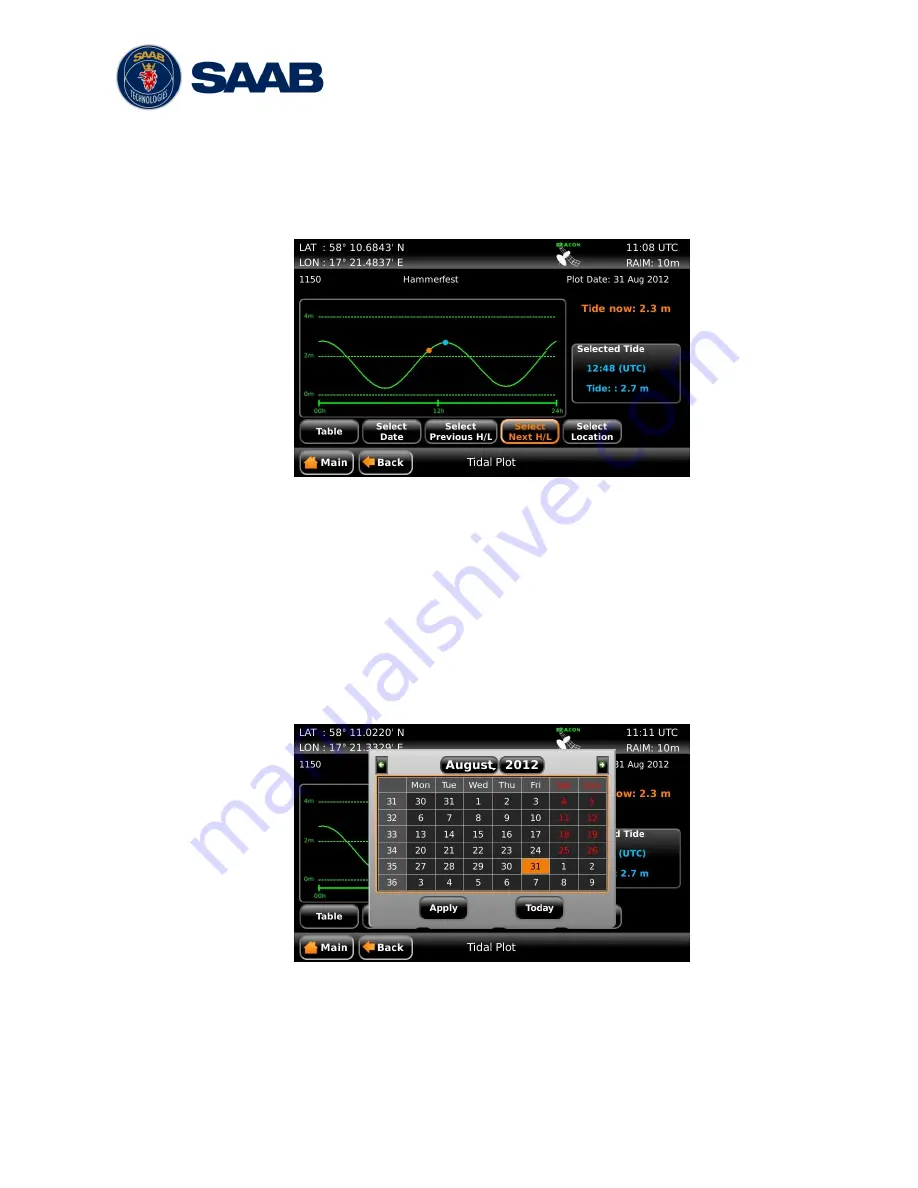
In order to calculate predictions for another day, click on the button
―
Select Date
‖ to
access an almanac where any date can be chosen.
Figure 76
– Tide Plot, Select Date
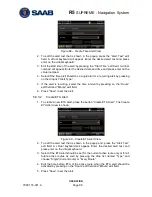
The tide predictions can also be represented as a table by clicking on the button
―
Table
‖. The maximum and minimum values for the selected date will be highlighted.
Содержание R5 SUPREME AIS
Страница 1: ...OPERATION INSTALLATION MANUAL Saab TransponderTech R5 SUPREME Navigation System ...
Страница 2: ...This page is intentionally empty ...
Страница 60: ...R5 SUPREME Navigation System OPERATION 7000 118 301 A3 Page 60 5 4 System Menus Tree View ...
Страница 103: ...R5 SUPREME Navigation System OPERATION 7000 118 301 A Page 103 Figure 92 Update Software ...
Страница 151: ...R5 SUPREME Navigation System MECHANICAL DRAWINGS 7000 118 301 A Page 151 14 2 CDU Panel Mount Cutout Hole dimensions ...

