100
Configuration Tab
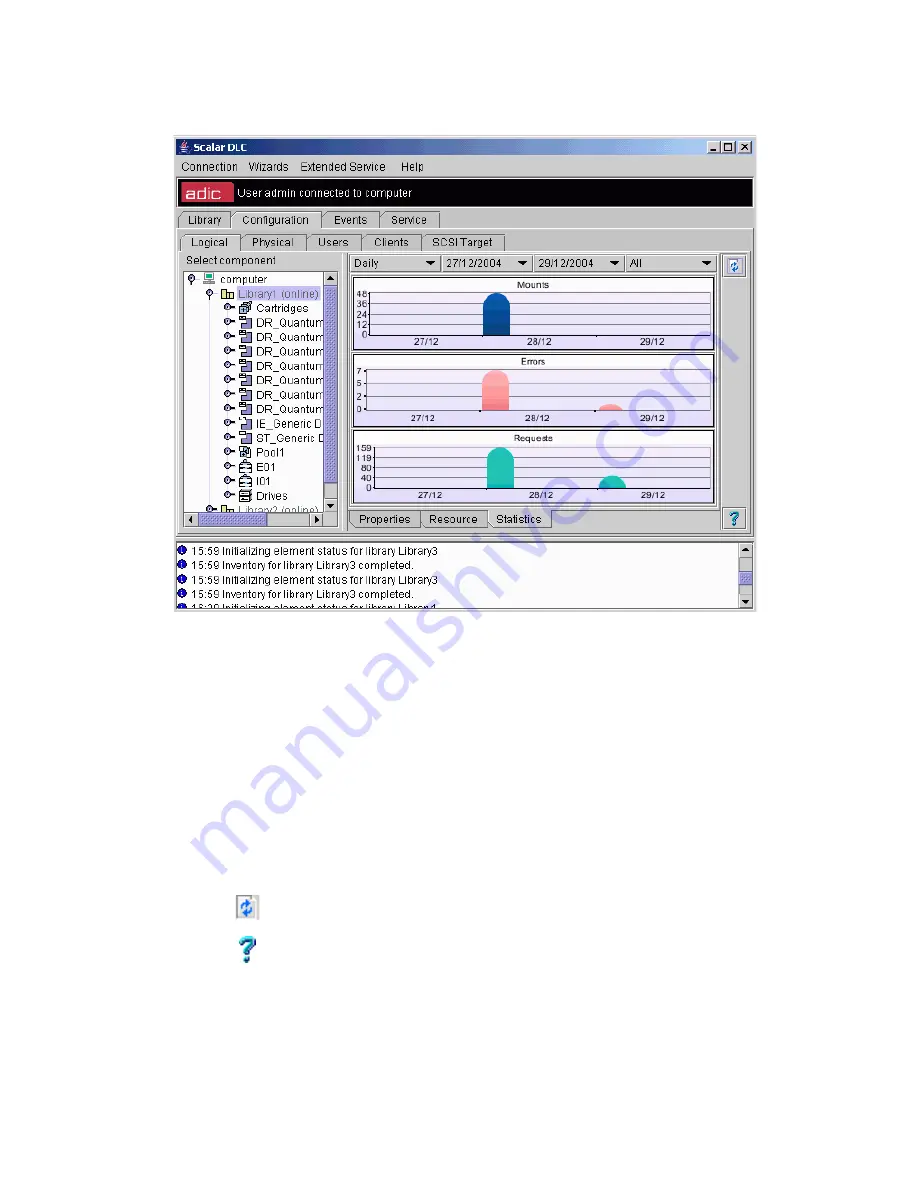
Statistics
Figure 71
Logical Library Statistics
Select the statistic rate, the date range, and the statistics type, and click on
Refresh
button to show the
statistic for the current logical library. By default, all statistics in daily range will be shown from the install
date up to current day.
Field/Button
Icon
Operation
Description
Statistics rate
Select
Show daily/weekly statistics.
Start date
Select
Start date in range.
End date
Select
End date in range.
Statistics type
Select
Statistics type (All / Mounts only / Errors only / Requests only).
Mounts
Supplied
Mounts executed in logical library.
Errors
Supplied
Errors encountered in logical library.
Requests
Supplied
Requests received by logical library.
Refresh
Click
Refresh Logical Library statistics.
Help
Click
Open online help for the current pane.
Содержание SDLC 2.7
Страница 1: ...ReferenceGuide Scalar DistributedLibraryController 2 7...
Страница 8: ...viii Table of Contents...
Страница 16: ...xiv Figures...
Страница 48: ...30 Configuration...
Страница 94: ...76 Management GUI...
Страница 206: ...188 Configuration Tab...
Страница 216: ...198 Events Tab...
Страница 272: ...254 Tools and Utilities...
Страница 294: ...276 Application Notes...
Страница 302: ...284 DAS Guide...
Страница 312: ...294 SCSI Guide...
Страница 320: ...302 ROBAR Guide...
Страница 324: ...306 Index...


