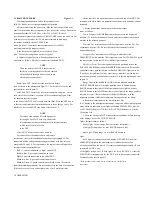
4.1 INTRODUCTION.
4.2 PRINCIPAL FUNCTIONS.
4.1 INTRODUCTION.
4.1.1 General.
This instrument uses an unusual method of measurement, which is quite
different from those used in previous impedance meters or bridges. A
thorough understanding of this method will be helpful in unusual
applications of the instrument. The following paragraph gives a brief overall
descrip. tion outlining the measurement technique to one familiar with
impedance measurement methods. A more detailed description of operation,
specific circuitry, and control signals is given later.
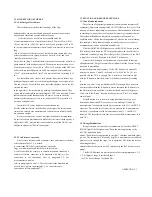
4.1.2 Brief Description of the 1657 Digibridge.
This Digibridge TM uses a new measurement technique, in which a
microprocessor calculates the desired impedance parameters from a series
of 8 voltage measurements.* These
measurements include quadrature (90°) and inverse (180°) vector
components of the voltage across the "unknown" impedance Zx and the
voltage across a standard resistor Rs
carrying the same current as Zx .Each of these measure
ments is meaningless by itself, because the current through
Zx is not controlled. But the 8 measurements are all made in rapid
sequence with the same phase-sensitive detector
and analog-to-digital converter. Therefore properly chosen differences
between these measurements subtract out fixed offset errors, and ratios
between the differences cancel out the value of the common current and
the scale factor of the detector-converter.
The phase-sensitive detector uses 4 reference signals, precisely 90°
apart, that have exactly the same frequency as the test signal, but whose
phase relationship to any of the analog voltages (such as the 8 mentioned
above) or currents (such as the current through Zx and Rs) is incidental.
Therefore, no precise analog phase shifter or waveform squaring circuit is
required. Correct phase relationships are maintained by generating test
signal and reference signals from the same high-frequency source.
There are no calibration adjustments in the Digibridge, thanks to the
measurement technique. The only precision
'Patent applied for.
4-1
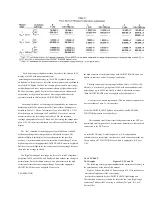
4-2
components in this instrument are three standard resistors
and a quartz-crystal stabilized oscillator. There is no reactance
standard. For example, C and D are calculated by the microprocessor
from the set of 8 voltage measurements and predetermined values of
frequency and the
applicable standard resistance.
The microprocessor also controls the measurement sequence, using
programs in the ROM memory and a few manual selections. The desired
parameters, C and D, Land Q, or R; equivalent circ,.uit, series or parallel;
and frequency, either 120 Hz (100 Hz) or 1 kHz, are selected by front
panel controls. There are also three manually
selected ranges, which have wide overlap. The optimum range for
any measurement is indicated by panel lights.
Each range is 2 decades wide, with reduced-accuracy
extensions both above and below. For example, consider resistance
measurement on Range 1 (F igure 3-2). The 2 decades extend from
02.000
Ω
, with an automatic decimal-point shift at 02.100 going up (at
020.00, going down) to 200.00
Ω
. The range extensions go as far as
can be displayed without further decimal-point shifting: upwards to
999.99
Ω
, downwards to 00.001
Ω
. Leading zeroes before the decimal-
point (0) are blanked out.
Test frequencies are within 2% of the front-panel indication.
However, for reasons related to rejection of power-line-frequency stray
signals that could be picked up by the D UT, thereby causing
measurement errors, the actual frequencies are as follows --accurate to
:+/-.0l% -
catalog number 1657-9700: 1020.0 Hz, 120.00 Hz
catalog number 1657-9800: 1000.0 Hz, 100.00 Hz.
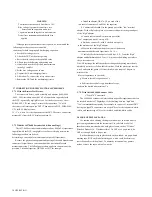
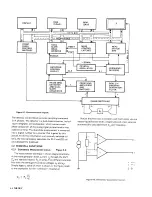
4.1.3 Block Diagram. Figure 4-1.
The block diagram
shows
the microprocessor (uP) in
the upper right corner connected by data and address buses to digital
circuitry including RAM and ROM memories, status and control latches,
and the front-panel display.
Analog circuitry is shown in the lower part of the diagram, where Zx is
supplied with a test signal at frequency f from a sinewave generator, driven
by a crystal-controlled digital
frequency divider circuit. The front-end amplifier circuit supplies an analog
signal that represents 2 impedances alternately: the internal standard, Rs,
and the DUT, Zx.
THEORY 4-1
Содержание 1657 RLC Digibridge
Страница 6: ...Table of Contents...
Страница 8: ...1 2 INTRODUCTION...
Страница 9: ...INTRODUCTION 1 3...
Страница 10: ...1 4 INTRODUCTION...
Страница 15: ...OPERATION 3 1...
Страница 24: ...4 2 THEORY...
Страница 30: ...5 4 SERVICE...
Страница 42: ...5 16 SERVICE...
Страница 46: ......
Страница 49: ......
Страница 50: ......
Страница 51: ......
Страница 52: ......
Страница 53: ......
Страница 54: ......
Страница 55: ......
Страница 56: ......
Страница 57: ......


