What the Eagle™ Records
••••
47
out during the entire recording session. (To recover the time
information, use the interval graph or an event-based report.)
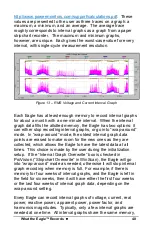
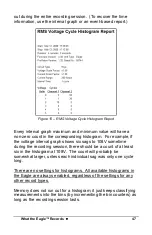
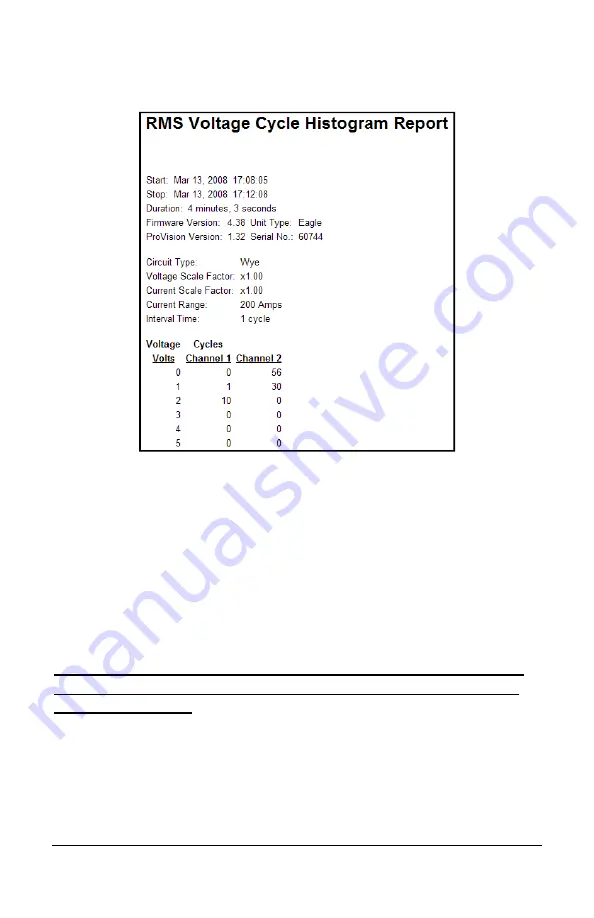
Figure 15 – RMS Voltage Cycle Histogram Report
Every interval graph maximum and minimum value will have a
non-zero count in the corresponding histogram. For example, if
the voltage interval graph shows six sags to 108V sometime
during the recording session, there should be a count of at least
six in the histogram at 108V. The count will probably be
somewhat larger, unless each individual sag was only one cycle
long.
There are no settings for histograms. All available histograms in
the Eagle are always enabled, regardless of the settings for any
other record types.
Memory does not run out for a histogram; it just keeps classifying
measurements into the bins (by incrementing the bin counters) as
long as the recording session lasts.
Содержание Eagle 220
Страница 2: ......
Страница 3: ...Eagle Power Quality Recorder User s Manual...
Страница 8: ......
Страница 12: ......
Страница 14: ......
Страница 32: ...Connecting the Eagle 24 Figure 8 Eagle Hookup Diagrams...
Страница 38: ......
Страница 42: ......
Страница 90: ......
Страница 95: ......
Страница 96: ......

