What the Eagle™ Records
••••
46
An interval graph can also be used for profiling, but that is not
ideal. The interval graph interval is usually set to an interval faster
than 15 minutes; a fast interval can show too much information,
making it hard to form a good average profile. Often the interval
graph only has enough memory for a week or two, limiting the
averaging time; the daily profiles have no such limit. Most
importantly, the interval graph does not divide the data into an
average day period, so it can be difficult to spot daily trends in the
graph.
Cycle Histograms
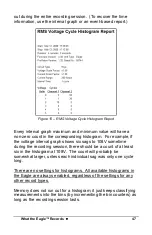
The cycle histograms contain valuable power quality information
as well as information for distribution line profiling. Questions
such as “what were the absolute highest and lowest RMS
voltage?”, “how many cycles was the voltage below 80V?”, and
“what are the most common load currents?” are easily answered.
The histograms also contain the raw data necessary to answer
more complicated statistical questions such as “What is the
probability of a voltage sag below 100V?” and “What high and low
limits does the line voltage meet 99.99% of the time?” While the
daily profiles give average current, power factor, etc. for
distribution profiling, the histograms show what values are the
most common– the “mode” in statistical terms.
What is Recorded
A histogram divides a measurement range into many bins. For
example, in the Eagle, the voltage histogram divides the 150V
voltage range into 150 bins, each one-volt wide, giving a bin for
0V, a bin for 1V, 2V, all the way to 150V. After each 60Hz cycle is
measured, the voltage is rounded to the nearest volt and placed in
the appropriate bin. The bins are really counters that count how
many cycles were at that voltage. If the 108V bin has a count of
45, then there have been 45 cycles with an RMS voltage of 108V
sometime during the recording session. The histogram does not
include time information: those 45 cycles could have occurred
anytime during the recording session. There may have been 45
cycles in a row, or three 15-cycle sags, or 45 isolated sags spread
Содержание Eagle 220
Страница 2: ......
Страница 3: ...Eagle Power Quality Recorder User s Manual...
Страница 8: ......
Страница 12: ......
Страница 14: ......
Страница 32: ...Connecting the Eagle 24 Figure 8 Eagle Hookup Diagrams...
Страница 38: ......
Страница 42: ......
Страница 90: ......
Страница 95: ......
Страница 96: ......

