What the Eagle™ Records
••••
44
Daily Profiles
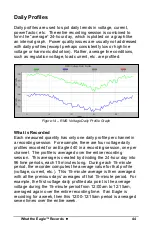
Daily profiles are used to spot daily trends in voltage, current,
power factor, etc. The entire recording session is combined to
form the “average” 24-hour day, which is plotted on a graph like
an interval graph. Power quality issues are usually not addressed
with daily profiles (except perhaps consistently low or high line
voltage or harmonic distortion). Rather, average line conditions,
such as regulation voltage, load current, etc. are profiled.
Figure 14 – RMS Voltage Daily Profile Graph
What is Recorded
Each measured quantity has only one daily profile per channel in
a recording session. For example, there are four voltage daily
profiles recorded for an Eagle 440 in a recording session, one per
channel. The profile is averaged over the entire recording
session. This average is created by dividing the 24-hour day into
96 time periods, each 15 minutes long. During each 15-minute
period, the recorder computes the average value for that profile
(voltage, current, etc.). This 15-minute average is then averaged
with all the previous days’ averages of that 15-minute period. For
example, the first voltage daily profile data point is the average
voltage during the 15-minute period from 12:00am to 12:15am,
averaged again over the entire recording time. If an Eagle is
recording for a week, then this 12:00-12:15am period is averaged
seven times over the entire week.
Содержание Eagle 220
Страница 2: ......
Страница 3: ...Eagle Power Quality Recorder User s Manual...
Страница 8: ......
Страница 12: ......
Страница 14: ......
Страница 32: ...Connecting the Eagle 24 Figure 8 Eagle Hookup Diagrams...
Страница 38: ......
Страница 42: ......
Страница 90: ......
Страница 95: ......
Страница 96: ......


