


NanoPlus Operator’s Manual
pH Maintenance Commands
Mar 2014
A-7
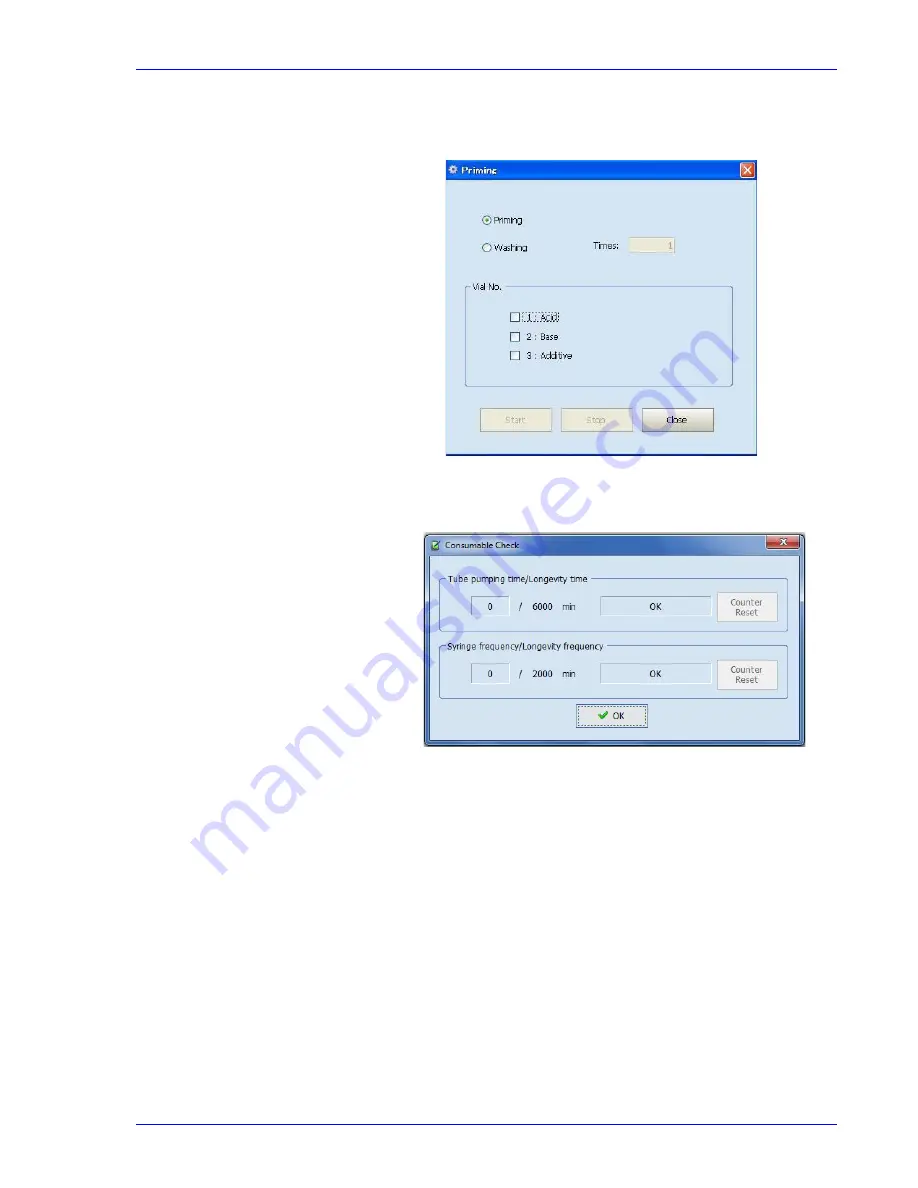
Priming
Displays the Priming dialog allowing you to fill or wash the tubing
for the selected vial.
Consumable Check
Enables you to check on the remaining life of the tubing and
syringe.
Use the
Counter Reset
when you have replaced either item.
Содержание NanoPlus
Страница 1: ...NanoPlus Zeta Potential Nano Particle Analyzer Operator s Manual V5 22 P09 42801 01 March 2014...
Страница 80: ......
Страница 114: ......
Страница 176: ...Consumables NanoPlus Operator s Manual A 30 Mar 2014 Tubing...
Страница 188: ......
Страница 192: ......
Страница 203: ...NanoPlus Operator s Manual AutoCorrelation ACF Function Mar 2014 D 11 Normal Log ACF ACF Noisy Low Sample Concentration...
Страница 213: ...NanoPlus Operator s Manual Temperature Gradient Plot Mar 2014 D 21 With Temperature Marker...
Страница 232: ......
Страница 246: ......
Страница 252: ......


