


58
optics11.com
7.1
Using the OP1550 interferometer
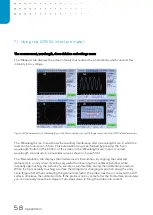
The measurement, wavelength, demodulation and settings menu
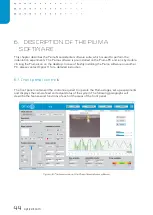
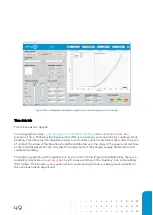
The ‘Measure’ tab displays the actual intensity that reaches the photodiode, which converts this
intensity into a voltage.
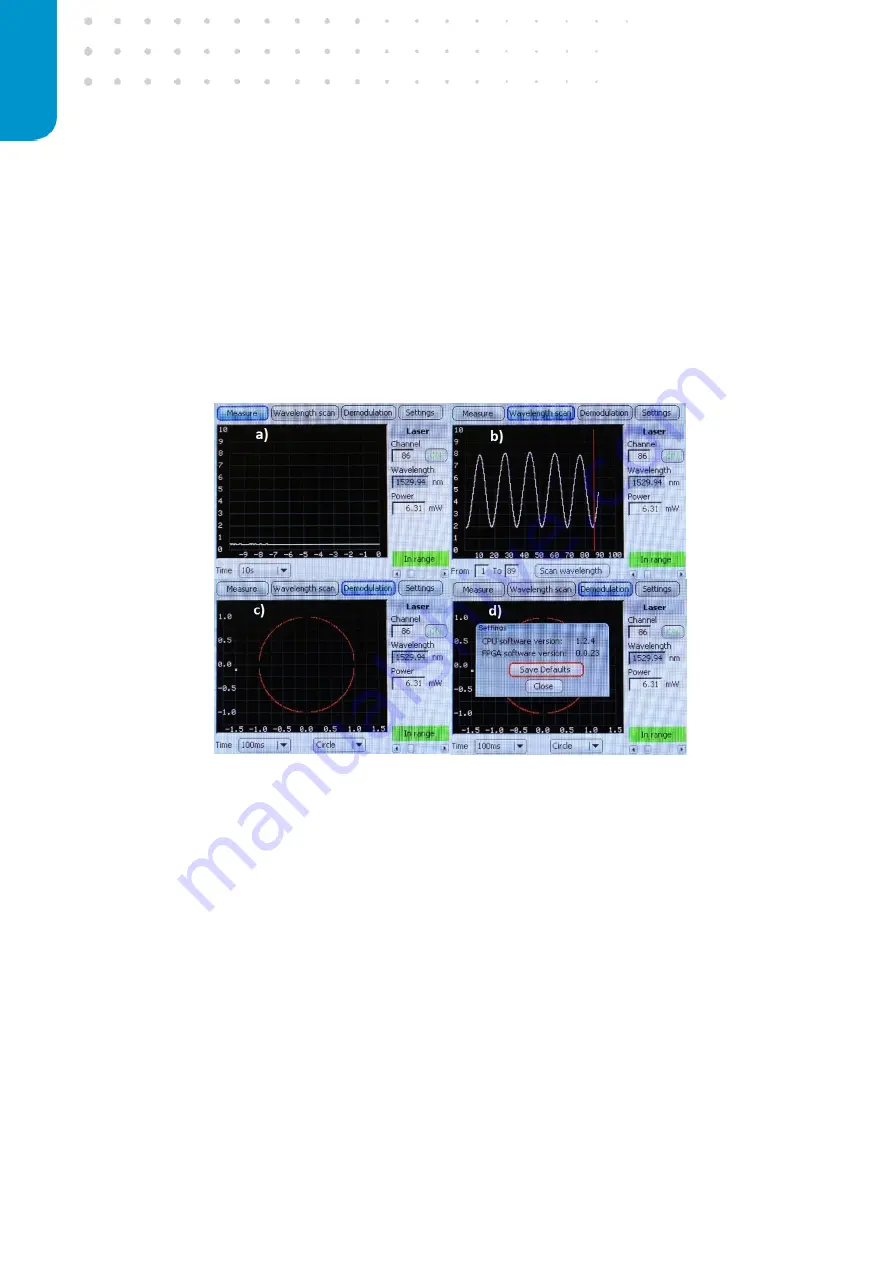
Figure 53: Measurement (a), Wavelength scan (b), Demodulation (c) and Settings menu (d) of the OP1550 interferometer.
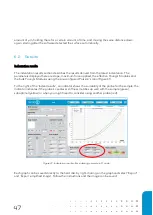
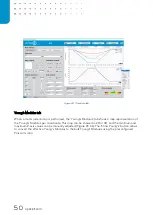
The ‘Wavelength scan’ menu shows the resulting interference after a wavelength scan in which the
laser can be tuned over ~50 nm. This automatic tuning is performed by pressing the ‘Scan
wavelength’ button at the bottom
of the screen in the ‘Wavelength scan’ menu.
A correct
wavelength scan results in a sinusoidal curve as shown in figure 53 b).
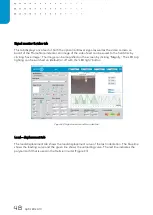
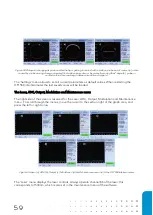
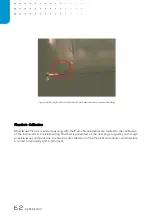
The ‘Demodulation’ tab displays the interferometric linearization, by aligning the collected
datapoints to a unity circle. It can be very useful for observing the cantilever bending, while
manually approaching the surface of a sample or a stiff surface during the calibration procedure.
When the tip is actually touching a surface the datapoint is changing its position along the unity
circle (Figure 54). When calibrating the geometrical factor, the probe must be in contact with a stiff
surface, otherwise the calibration fails. If the probe is not in contact after the find surface procedure,
you can manually move the Z-stage in 1µm-steps down to bring the probe into contact.
Содержание CHIARO NANOINDENTER
Страница 1: ...PIUMA NANOINDENTER USER MANUAL ...
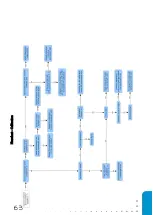
Страница 63: ...63 Flowchart Calibration ...
Страница 65: ......