1-10 ChartScan – Unit Startup and ChartView Tutorial
ChartScan User’s Manual
ChartView, Basic Concepts
An understanding of the following basic concepts will help you master
ChartView
more quickly, and
should be understood before proceeding with the tutorial.
Configuration Files
ChartView
makes use of one or more “user transparent” configuration files. Configuration files
maintain information regarding various aspects of your setup, serving as an initialization file for
subsequent
ChartView
startups. These files can be recognized by their
.cvw
extensions.
When you run
ChartView
for the very first time there will be no configuration file.
However, a configuration file will be generated and be saved, automatically, after
each use of the program.
ChartView
uses
Chartvw.cvw
as a default configuration file. This file maintains a location for
ChartView
configuration information including:
•
Device Interface Mode
•
Hardware Configuration
•
Channel Settings:
⇒
Channel Enable/Disable (On/Off)
⇒
Type
⇒
Label
⇒
Units
⇒
Alarm Settings (Limits)
⇒
Hysteresis Setting
•
Acquisition Configuration
•
Data Storage Settings
The configuration file ensures that when you restart
ChartView
, it will be in the same state upon your
last exit. This means that the
Chartvw.cvw
file will be an updated copy of the configuration file you
are using at the time you exit
ChartView
.
It is not catastrophic if a configuration file is deleted, since it is a simple task to start
ChartView
when
no configuration file exists. This is described in the tutorial.
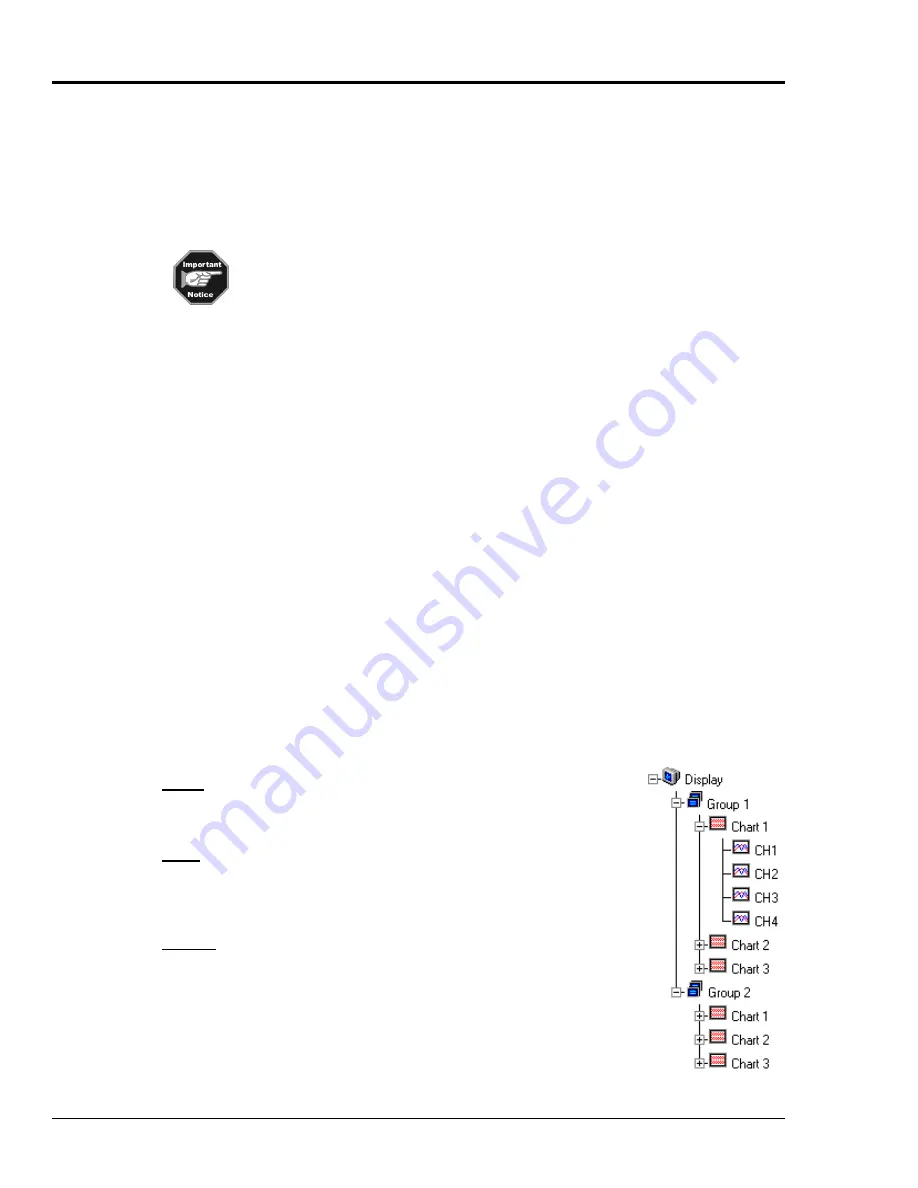
Understanding Groups, Charts, & Channels
When starting the program with no configuration file present, a feature called
Chart Setup Wizard
is
automatically activated to assist you with your setup. To make the best use of
Chart Setup Wizard
you
need to understand the relationship of Groups, Charts, and Channels.
Note:
ChartView
,
ChartView Plus
, and
Chart Setup Wizard
are detailed in Chapter 4 of this manual.
Group
. “Group” refers to a group of charts.
ChartView
makes use of one
chart group.
ChartView Plus
allows up to 64 groups, depending on the
capabilities of your PC, but only displays data from one chart group at a
time.
Chart
. “Chart” refers to display area which reflects real-time channel data
values and can be scrolled at various rates. One chart can display data from
up to four channels. In addition, each chart will display real-time
information for a selected channel. You can assign up to 16 charts per
group.
Channel
. “Channel” refers to a signal channel. You can have up to 4
channels assigned to one chart. Channels will be displayed in units of °C,
°F, °K, °R, mV, V, or in user-defined units, depending on the configuration
and type of signal conditioning card used. ChartScan’s signal conditioning
card options are detailed in Chapter 3.
Содержание OMB-CHARTSCAN 1400
Страница 1: ...August 2002 OMB CHARTSCAN 1400 Portable Data Recorder p n OMB 483 0901 Rev 3 1...
Страница 6: ...iv ChartScan User s Manual...
Страница 24: ...ChartScan User s Manual...
Страница 32: ...2 8 General Information ChartScan User s Manual Notes...
Страница 56: ...3 24 ChartScan User s Manual Notes...
Страница 117: ...ChartScan User s Manual Calibration 6 13 1 Connect an applicable calibration harness to each card Refer to figure below...
Страница 124: ...6 20 Calibration ChartScan User s Manual...
Страница 126: ...A ii ChartScan User s Manual...
Страница 136: ...API Commands Appendix A A 10 ChartScan User s Manual Notes...
Страница 176: ...API Commands Appendix A A 50 ChartScan User s Manual...
Страница 230: ...Appendix C Registers Data Formats Queries ChartScan User s Manual C 13...
Страница 237: ...Registers Data Formats Queries Appendix C C 20 ChartScan User s Manual Notes...
Страница 257: ...E 2 ChartScan User s Manual Notes...
Страница 265: ...ASCII Code Summary Appendix F F 8 ChartScan User s Manual Notes...
Страница 269: ...Abbreviations Appendix H H 2 ChartScan User s Manual Notes...
Страница 271: ...ChartScan User s Manual...


