159
Horizontal Scan
Horizontal Scan
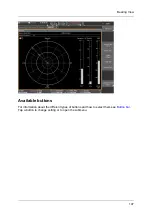
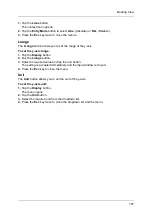
Horizontal Scan plots the signal strength versus the angle of incidence on a polar diagram.
The measured signals are normalized to the maximum value linearly during the
measurement (1 = 100 % signal strength). The display allows you to more easily see the
difference between the received signal and the reflections that occur. The SignalShark
automatically calculates the bearing of the signal source based on the horizontally measured
values.
The calculation of the main angle of incidence is performed where possible using a quadratic
regression of the measured values obtained. Otherwise, the azimuth angle of the maximum
level is assumed to be the direction of transmission and a message to this effect is displayed.
General operating steps
Following step may help you to successfully run a horizontal scan:
Содержание Narda SignalShark
Страница 1: ...User Manual Version 2019 07 ...
Страница 2: ......
Страница 14: ......
Страница 15: ...15 Online Help Version 2019 07 ...
Страница 16: ......
Страница 31: ...Introduction 31 Figure Loop antenna frequency range 9 kHz to 30 MHz ...
Страница 32: ......
Страница 38: ......
Страница 44: ......
Страница 60: ......
Страница 66: ......
Страница 74: ......
Страница 88: ......
Страница 104: ......
Страница 118: ......
Страница 132: ......
Страница 158: ......
Страница 198: ......
Страница 204: ......
Страница 214: ......
Страница 226: ......


