Basic Operation
51
Press the
Esc
key or tap the header of the
Button bar
.
Creating a screenshot
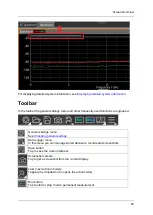
In the toolbar tap the
button.
A screenshot of the active window is stored to the memory.
Stored screenshots can be found in this folder:
D:\Narda_SignalShark\Datalogger\Screen Shots
Using Tasks and Views
The design and GUI layout of SignalShark is based on customer applications. This can be
seen most clearly in the concept of Tasks and Views.
Tasks
The measurement task of a customer application often consists of several measurements,
like finding a signal in the spectrum, measuring its level and drawing it into a map. In most
cases, SignalShark can handle a complete workflow in one single task:
•
Tasks are represented by a tab on the screen, like a web site within a web browser.
•
They encapsulate all measurement parameters and the underlying measurement engine
working mode.
•
Within a task, all measurements are performed at the same time.
The creation of a task is the prerequisite for being able to perform a measurement at all. To
support a wide variety of measurement applications, SignalShark provides several task
modes:
•
(Scan) Spectrum Mode
This mode supports measuring the spectrum with full frequency span of 8 kHz up to
8 GHz within one measurement and a maximum measurement speed of 40 GHz/s.
•
RT Spectrum Mode
The Real-Time Spectrum Mode enables real-time spectrum measurements with a
frequency span of up to 40 MHz. This frequency span will be acquired simultaneously in
frequency and also gapless in time with 3.125 µs POI.
•
Auto DF Mode
The Auto Direction Finding Mode supports control of the automatic DF antennas and
handles the calculation of bearings out of the DF data.
Views
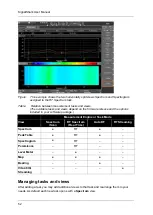
A view is a window containing a specific visual representation of measurement data. Up to
six views can be added to a task and arranged to your personal needs and taste.
Содержание Narda SignalShark
Страница 1: ...User Manual Version 2019 07 ...
Страница 2: ......
Страница 14: ......
Страница 15: ...15 Online Help Version 2019 07 ...
Страница 16: ......
Страница 31: ...Introduction 31 Figure Loop antenna frequency range 9 kHz to 30 MHz ...
Страница 32: ......
Страница 38: ......
Страница 44: ......
Страница 60: ......
Страница 66: ......
Страница 74: ......
Страница 88: ......
Страница 104: ......
Страница 118: ......
Страница 132: ......
Страница 158: ......
Страница 198: ......
Страница 204: ......
Страница 214: ......
Страница 226: ......

