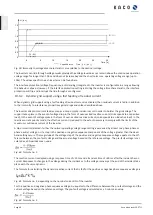
Page 63] and [See figure 52] [
Page 63] are two examples of configuration. In figure 1 without hys-
teresis, the function is activated as soon as the voltage exceeds the configured voltage of data point 1 (dp1). The power
limit follows the characteristic curve, a straight line between dp1 and dp2. The function is deactivated as soon as the
voltage falls below dp1. In [See figure 52] [
Page 63], the function is activated as soon as the voltage exceeds the con-
figured voltage of dp2. In this case, dp1 does not result in activation of the function because the power limit remains at
100%. The power limit follows the characteristic curve, a straight line between dp2 and dp3. However, because hysteresis
is activated, the power limit is not increased when the voltage drops. The function is deactivated as soon as the voltage
falls below dp1.
Voltage
P
/
Pref
dp
1
dp
2
Fig. 51:
Example characteristic curve without hysteresis
P
/
Pref
dp
1
dp
3
dp
2
Voltage
Fig. 52:
Example characteristic curve with hysteresis and a
deactivation threshold below the activation threshold
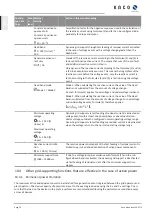
10.2.2.1 Parameters for P(U)
Country-
spec. Set-
tings
Men
u
level
Display/
Setting
Action in this menu/meaning
4
1
2
3
4
P(U) operation mode
Off | On
F
Activate the control process.
Off: Deactivates dynamic grid support using dynamic reactive current.
Dynamic grid support remains active on account of immunity to inter-
ference.
Reference power
Actual power |
Nominal power
Specifies the power reference for the characteristic curve. 100 % here
corresponds to the nominal power or the actual power at the time the
function was activated, the time when the voltage passes the con-
figured node.
4
1
2
3
4
Evaluated voltage
Maximum phase
voltage | Positive
phase sequence
voltage
F
Select the voltage to be rated.
Specifies which voltage is evaluated in a three-phase system.
Hysteresis mode
Off | On
Off: In non-hysteresis mode, the active power is increased immediately
with dropping voltage.
On: In hysteresis mode, the power is not increased with dropping
voltage. .
Deactivation gradient
0 – 65534 [% / min]
If the available power is above the actual output at the time of deactiva-
tion, the power increase back to the maximum power is limited. The
limitation is implemented by an absolute power limitation that in-
creases with a continuous gradient up to the maximum power. The ac-
tual power of the inverter may vary freely below this limit due to a pos-
sible fluctuation in the available power or the target value, but at no
time increases above the absolute power limit.
Deactivation time
0 – 60000000 [ms]
Only evaluated with activated hysteresis mode: Monitoring time during
which the voltage must remain below the lowest configured node be-
fore the function is deactivated.
Kaco blueplanet 29.0TL3
Page 63
EN

