


Chapter 9 P2P
9
Pnet I/F Module 2MLL-PSRA, 2MLL-PMEA, 2MLL-PMEB User
’s Guide
R220
Honeywell
January 2019
9.5 P2P Information
After set the driver of communication module, P2P diagnosis shows status of service and
information about communication program. User can check the P2P service with variable monitor of
monitor menu or diagnosis system.
(1) Variable monitor
Variable monitor is one of diagnosis function with flag monitor of SoftMaster. Select
[Variable Monitor] on the [View] menu, then [Figure 9.5.1] will be open. Register the flags
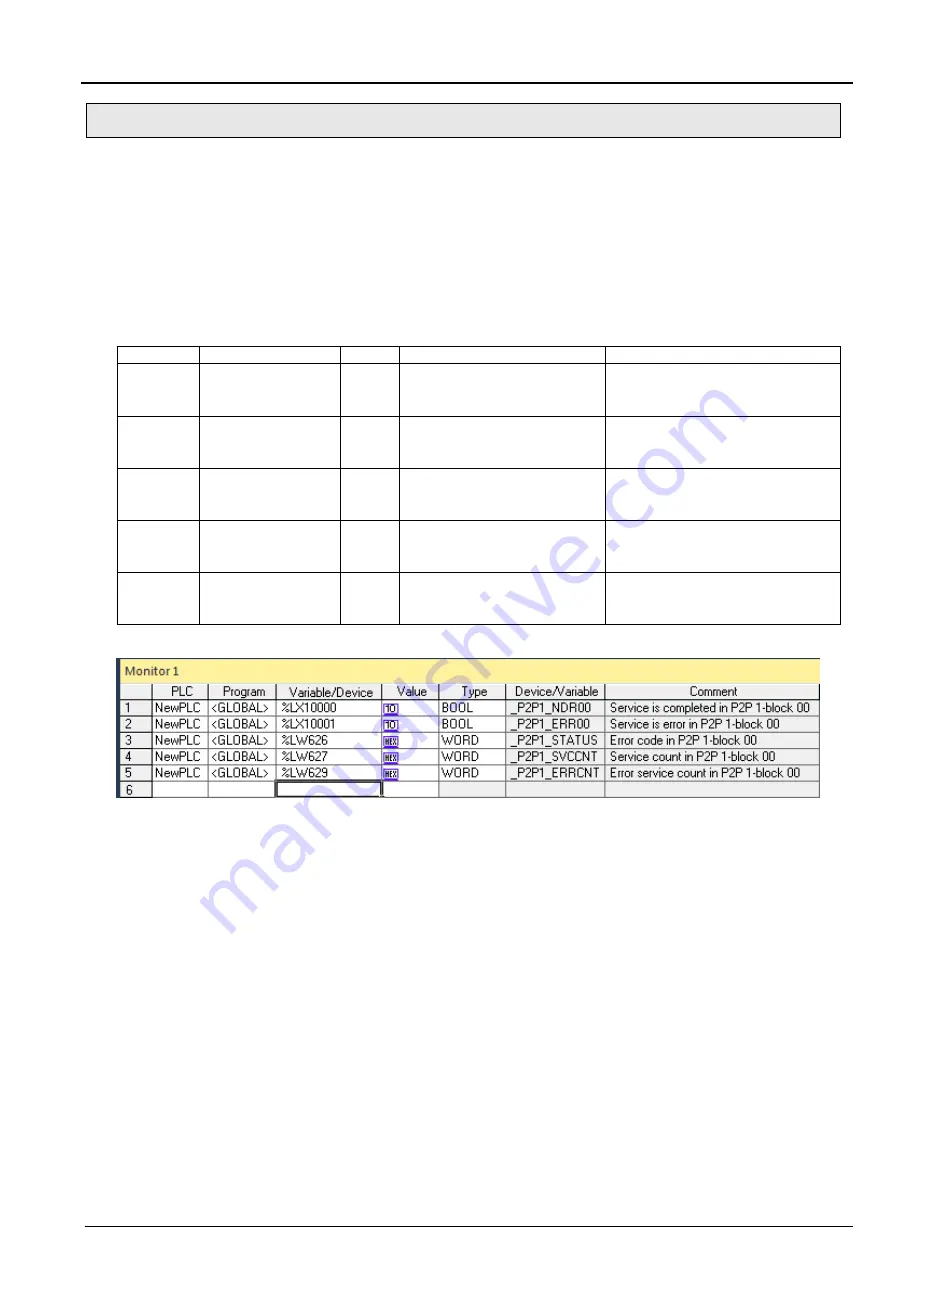
which are going to monitoring at variable monitor window. _P2PxNDR[n], _P2PxERR[n],
_P2PxSTATUS[n], _P2PxSVCCNT[n], _P2PxERRCNT[n] are array type flags, so user has
to select the number of array. The number of array means the block in the parameter.
Device
Keyword
Type
Detail
Description
%LX10000 _P2P1_NDR00
Bit
P2P parameter No.1, block
No.00
service
complete
normally
P2P parameter No.1, block No.0
service complete normally
%LX10001 _P2P1_ERR00
Bit
P2P parameter No.1, block
No.00
service
complete
abnormally
P2P parameter No.1, block No.0
service complete abnormally
%LW626
_P2P1_STATUS00 Word
Error code if P2P parameter
No.1, block No.00 service
complete abnormally
Error code displayed if P2P
parameter
No.1,
block
No.0
service complete abnormally
%LW627
_P2P1_SVCCNT00 DWord
P2P parameter No.1, block
No.00
service
normal
execution times
P2P parameter No.1, block No.0
service normal execution times
displayed
%LW\629 _P2P1_ERRCNT00 DWord
P2P parameter No.1, block
No.00
service
abnormal
execution times
P2P parameter No.1, block No.0
service abnormal execution times
displayed
[Table 9.5.1] P2P Information feature
[Figure 9.5.1] P2P variable monitor window
(2) P2P service
It shows detail information about P2P service. After set the P2P parameter and enable the
link, it reads the status of service.
Single and continuous real-time monitoring are available through this menu.
How to open this menu is as follow
(a) Select
‘Connection’ -> ‘Online’-> ‘Communication module setting’-> ‘System diagnosis’
in SoftMaster.