


023-00354-Rev1.4 evc/epc
User
Manual
Copyright © High Country Tek, Inc. – 2013
13
evc/epc
Controller
With
SAE
J1939
Interface
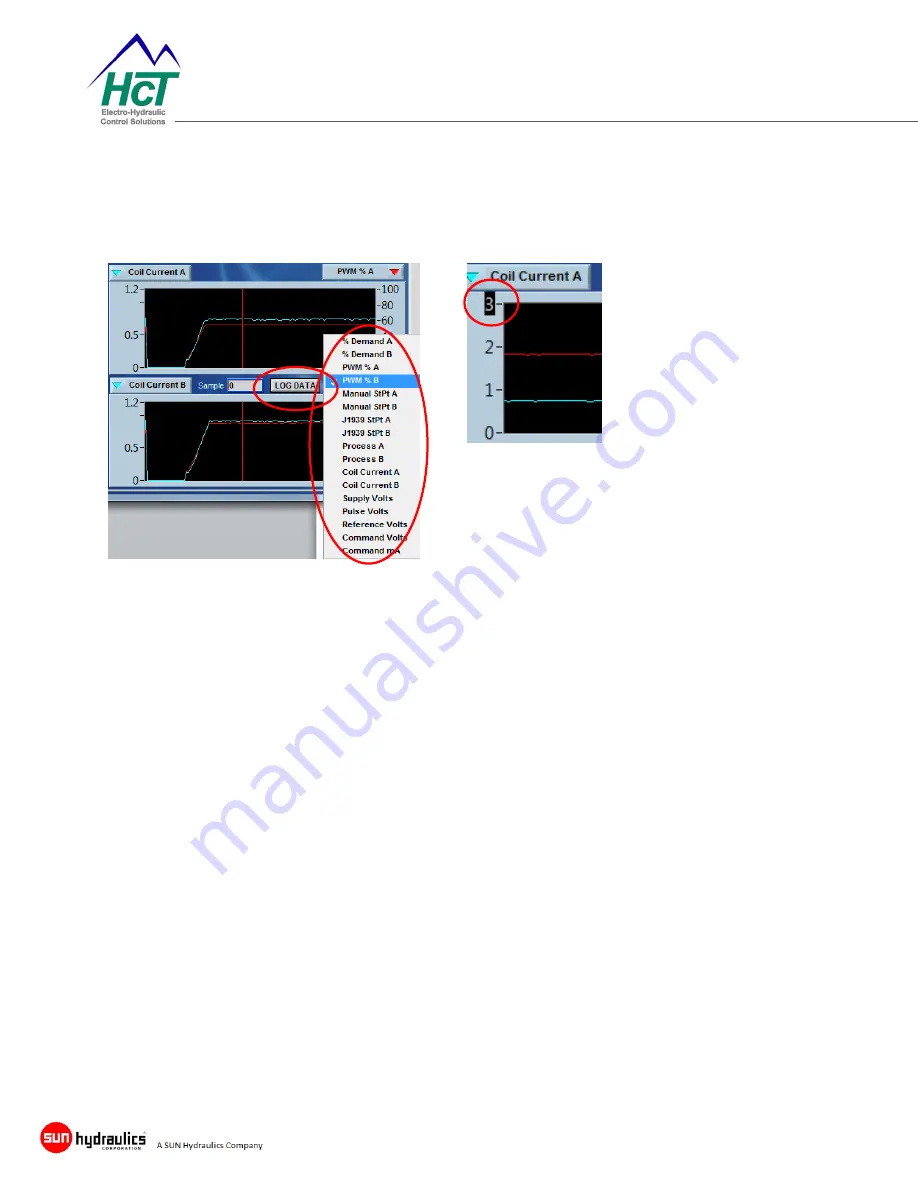
Each graph tracks two variables that are individually scaled. Select the variable from the
Pull Down
Menus
. “Y” axis is automatically scaled to the respective minimum and maximum values.
To customize the scaling, simply select a value on the graph and enter the desired value.
Data Logging
“Log Data” and save it in “.xls” format. The data can be as big as your PC memory capacity.
Each log begins with a list of unit settings and is followed by real time operational information. The
sample rate depends on the workload of the PC and the evc/epc at recording. A timestamp scales the
logs appropriately.
Subsequent logs may be stored in a new file or appended to the original log file by
selecting the original file.
The log file may not have all of the Excel formatting. Excel may declare an unknown file format. If it does,
select
Open
and the information will display normally.