F
LEXCELL
®
I
NTERNATIONAL
C
ORPORATION
8
coordinates
for the waveform. These are
displayed when the left mouse button is
clicked and held down in the graph area.
When this is done, a pair of crosshairs appears
and the coordinates at the intersection of the
crosshairs are shown in the X and Y spaces.
The crosshairs and values will track the mouse
as long as the left mouse button is held down.
The next block to the right is a section used to
display the current
User
,
Regimen
,
Platform
,
and
Run time
. Run time has two blocks. The
one on the left displays the elapsed regimen
time, and the one on the right displays the
remaining regimen time, using the following
format:
dd:hh:mm:ss
(days:hours:minutes:seconds).
The block at the top right contains the current
regimen
Step
,
Cycle
,
Jump
(when a regimen
step is using the Jump Back to option),
minimum level (
Min
), and maximum level
(
Max
). The minimum and maximum levels
will be listed according to the units specified
under the Plot Units section as the minimum
and maximum points at which the membrane
stretches with each cycle.
The major portion of the main display window
is taken up with a
plot
designed to show the
current state of a simulated or running
regimen. This plot is generated from the data
returned by the FlexLink
®
during regimen
activity. When using a platform configuration
that uses vacuum to generate a downward
stretching of the membrane (elongation), the
vertical
scale
represents
increasing
elongation, vacuum or strain. When the
selected unit of display is kPa, the vertical
scale will start at 0.0 and move upwards as an
increasing negative pressure level, indicating
that a vacuum is being applied to the
membrane to stretch it downwards.
The scale on the x- and y-axes can be changed
by clicking on one of the two small double-
arrow buttons at either end of the axis. The
button with arrows pointing away from each
other increases the axis scale, while the
button with arrows pointing toward each
other decreases the scale.
Below the plot is a
timeline
that displays the
percentage of the regimen that has been
completed.
To the right of the plot is a set of command
buttons which allow the user to:
1)
Start
a regimen.
2)
Stop
a regimen.
3)
Pause
a regimen.
4)
Resume
a paused regimen.
5)
Simulate
a regimen.
6)
Reset
the controller.
7) Access
Help
.
8)
Cancel
the program.
3.4 C
ONFIGURING
U
SERS
Prior to creating and downloading a
regimen, a user needs to be registered. Once
this task is completed, regimens can be
personalized under the registered user name.
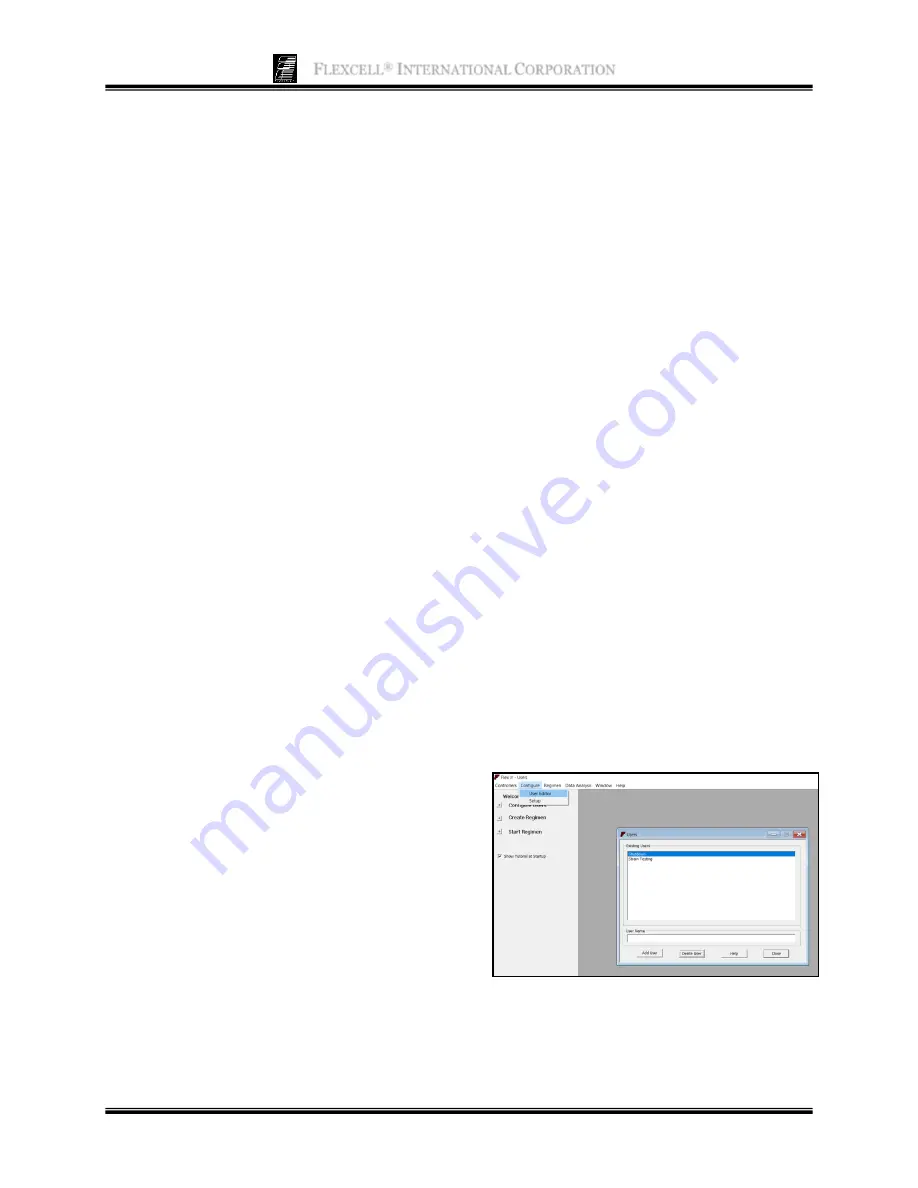
In the
Configure
menu, select
User Editor
.
A new window will appear entitled
Users
(Fig. 9).
Figure 9.
Flex Jr.
™
user editor
To add a user, type in a user name (must be
at least 4 characters) in the provided space


