Leaders in Pipelin
e Survey Systems
C
C
C
-
-
-
S
S
S
C
C
C
A
A
A
N
N
N
2
2
2
0
0
0
1
1
1
0
0
0
SYSTEM MANUAL Version 6.03i
43
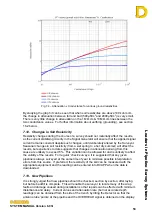
The graph in Fig 6.16 shows attenuation values as the points were gathered i.e.
sequenced in time (
). The two low reading of points #00
#01 & #01
#02 are
followed by the 10mB/m reading between points #02
#03 as these were the order in
which they were taken. Finally, the low attenuation of points #03
#04 can be seen.
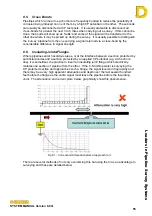
If we re-sequence the graph by Chainage (
), then the attenuations are now calculated
in distance order. The attenuations for points #00
#01, #01
#02 remain unchanged, but
now the attenuation for points #02
#04 & #04
#03 can be seen, as in Fig 6.17
The Graphs can be switched between order (
) and Chainage (
) by selecting the
appropriate key.
Fig. 6.16
Attenuations by order
Fig. 6.17
Attenuations by distance
Using the
◄
# and #
►
arrow keys, you can choose a section of the survey and the details
for section will be displayed above the graph. If the graph is being viewed in time mode
(as the points were gathered – Fig 6.16) then the points will increment in order. If you
switch to Chainage mode (Fig 6.17) then the using the
◄
# and #
►
arrows will increment
in distance order. So in the example above, we can switch to chainage mode and scroll
through the points and see the attenuation between #02 and #04 is 19.25 mB/m.
6.8.2. Close Interval Mode
Once a Closer Inspection has been carried out on a section of pipeline with higher than
average readings, a Close Interval Current Only survey can be used to pin-point an
anomaly with greater accuracy (to /-3ft or better depending on conditions).
The method of conducting a Close Interval survey is similar to normal C-SCAN surveying
but with a few difference. Firstly, in Close Interval mode the distance between survey
points is chosen first, and is always the same spacing. Secondly, Close Interval surveying
only calculates the current on the pipeline and does not calculate the attenuation. Normal
attenuation readings have no meaning when the distance interval is less than (<) 50ft.
This is because small distances create large attenuations on small current changes – this
effectively makes the attenuation values difficult to interpret. The Close Interval mode
uses current only to map a section of pipeline.


