Leaders in Pipelin
e Survey Systems
C
C
C
-
-
-
S
S
S
C
C
C
A
A
A
N
N
N
2
2
2
0
0
0
1
1
1
0
0
0
SYSTEM MANUAL Version 6.03i
45
When a reading is ready to be taken, the calculate key (
) is used as normal. The
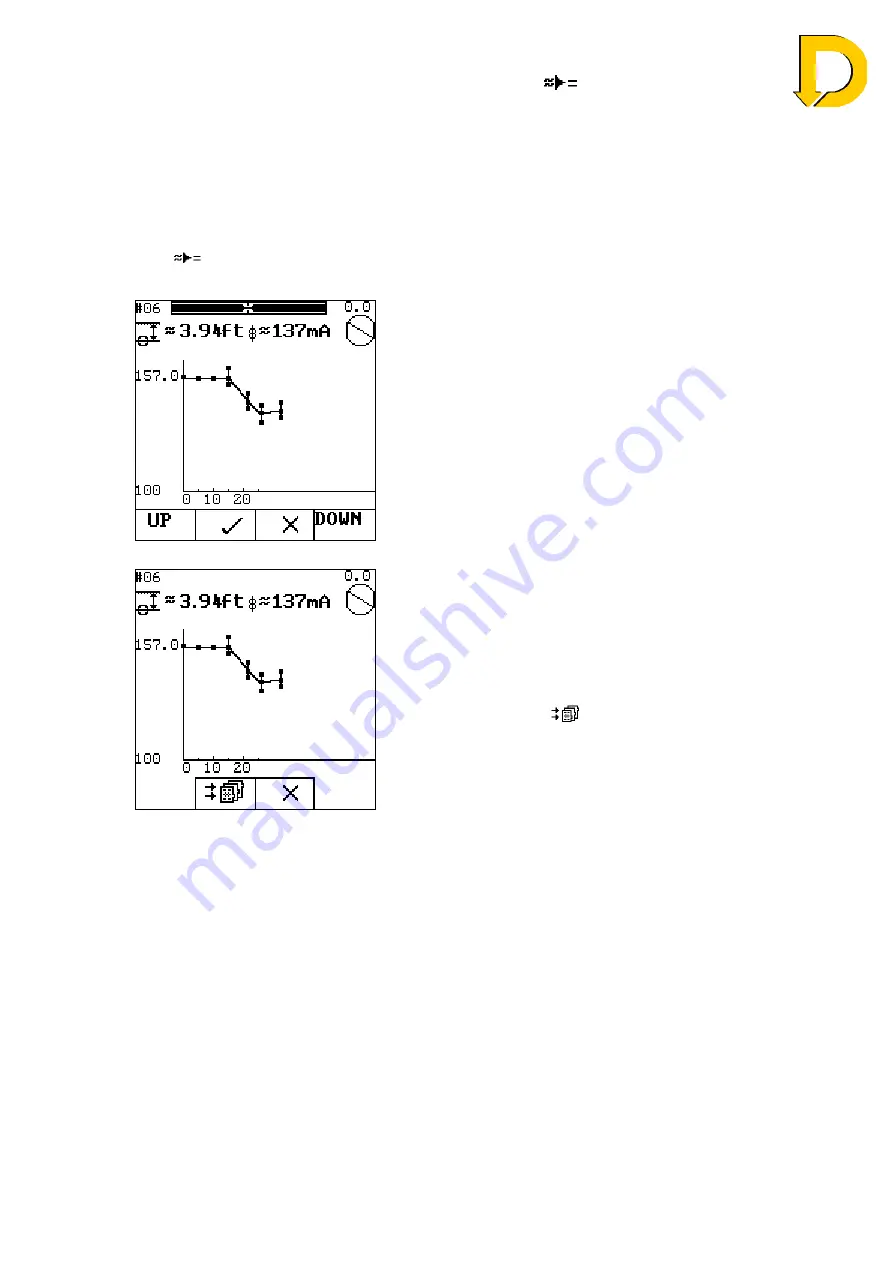
Detector will take a range of samples as before, but instead of changing to the STORE
screen, the graph changes to a vertical bar showing the maximum, minimum and average
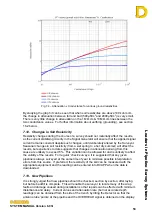
current readings taken for this point. This can be seen in Fig 6.21, below, where several
samples have already been taken.
Move along the pipeline to the next interval point (in this case 3.94ft) and use the Pipeline
Position circle and Overhead bars at the top of the screen to ensure you are correctly
located over the pipeline. When you are ready to take the next reading press the calculate
key [
] as before and the survey continues – this is shown on the following screen after
several readings have been taken:
Fig. 6.21 – Close Interval Profile
The
UP
and
DOWN
keys allow you to zoom in on the
graph. Press
³
to ignore the sample and retake the
reading or press to accept the reading.
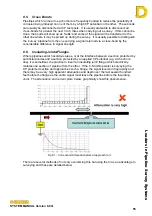
After several readings, the current profile shown by
the graph identifies where the current on the pipeline
starts to drop before levelling out again. This drop in
current is centred on a single anomaly in the coating.
Fig. 6.22 – Storing Close Interval
survey
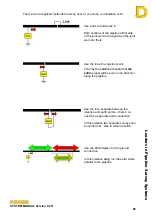
The survey may continue for as far as necessary. The
graph will auto-scale to fit the points. When enough
points have been taken and you wish to finish the
Close Interval survey, press
STOP
. The following
screen will be shown.
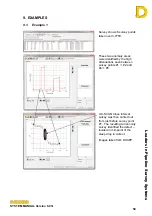
Press the store key [
] to finish the Close Interval
survey and save the data. Pressing
³
will not delete
any data but will cancel the data saving and allow you
to continue with the close interval survey.
After pressing the store key, the screen will revert to
the search screen.


