116
•
Appendix B: Troubleshooting Problems
Xtium2-CXP PX8 User's Manual
Troubleshooting Procedures
The following sections provide information and solutions to possible Xtium2-CXP PX8 installation
and functional problems. The previous section of this manual summarizes these topics.
Diagnostic Tool Overview
The Xtium2-CXP PX8 Board Diagnostic Tool provides a quick method to see board status and
health. It additionally provides live monitoring of FPGA temperature and voltages, which may help
in identifying problems.
A shortcut to this tool is in the Windows Start menu under the Teledyne DALSA/Xtium2-CXP
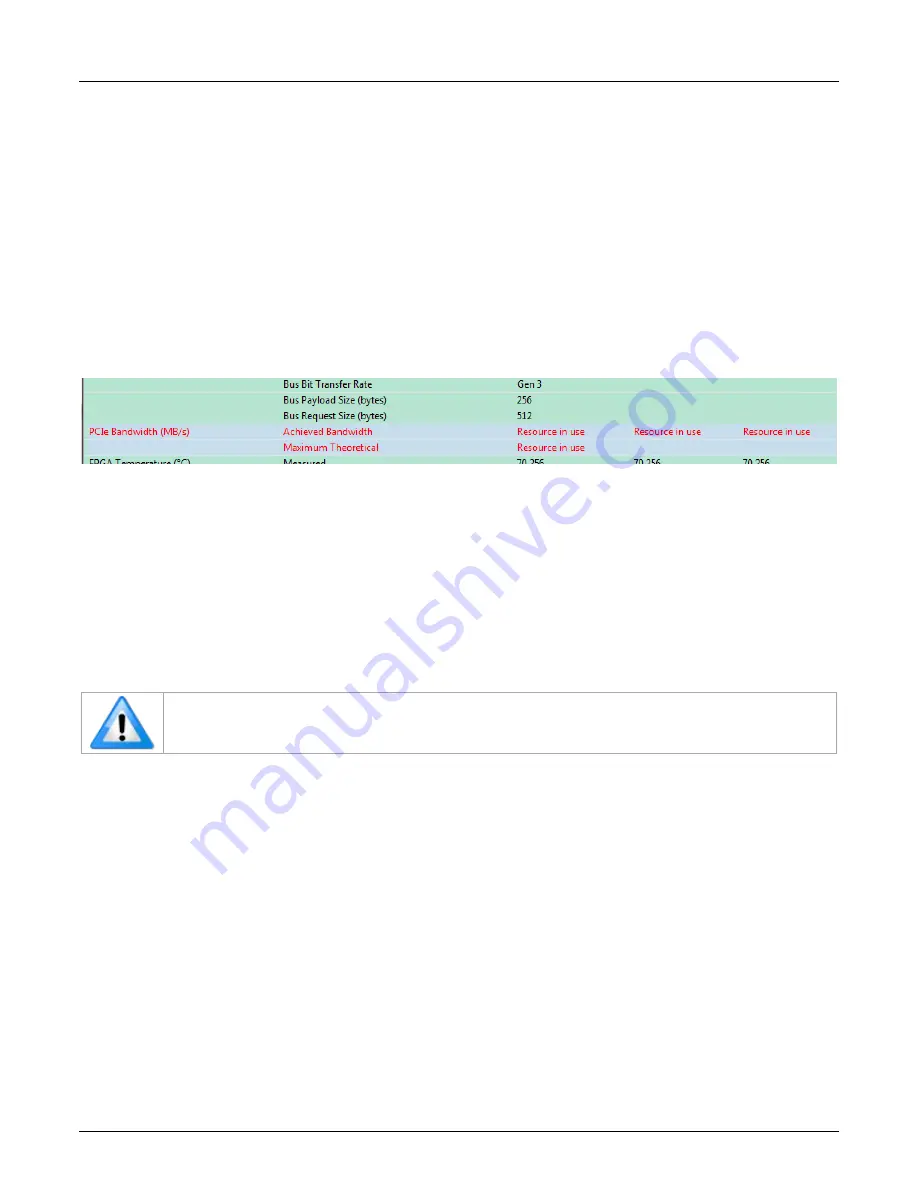
PX8 folder. Do not have any other Sapera application running that connects to the Xtium2 such as
CamExpert, else the diagnostic window will indicate an error for the PCIe Bandwidth, as shown in
the screen capture below.
Figure 49: Diagnostic Tool “Resource in use”
Diagnostic Tool Main Window
The main window provides a comprehensive view of the installed Xtium2 board. Toolbar buttons
execute the board self-test function and open a FPGA live status window.
Important parameters include the PCI Express bus transfer supported by the host computer and
the internal Xtium2 FPGA temperature. The bus transfer defines the maximum data rate possible in
the computer, while an excessive FPGA temperature may explain erratic acquisitions due to poor
computer ventilation.
Note: The Lane Stats for each camera are aggregated into the lane # detected as master.
However 8b/10b error statistics are compiled for each lane independently.


