100
The work of the Buffer Manager is shown by the green line, which is the target buffer delay that the system is trying
to achieve, based on measurements done over the jitter window.
The lower half of the
Peer Stats
display shows a real time and historical representation of frame loss. If the decoder
does not receive packets in time, the chart will show a red line indicating percentage of lost packets over the one-
second interval.
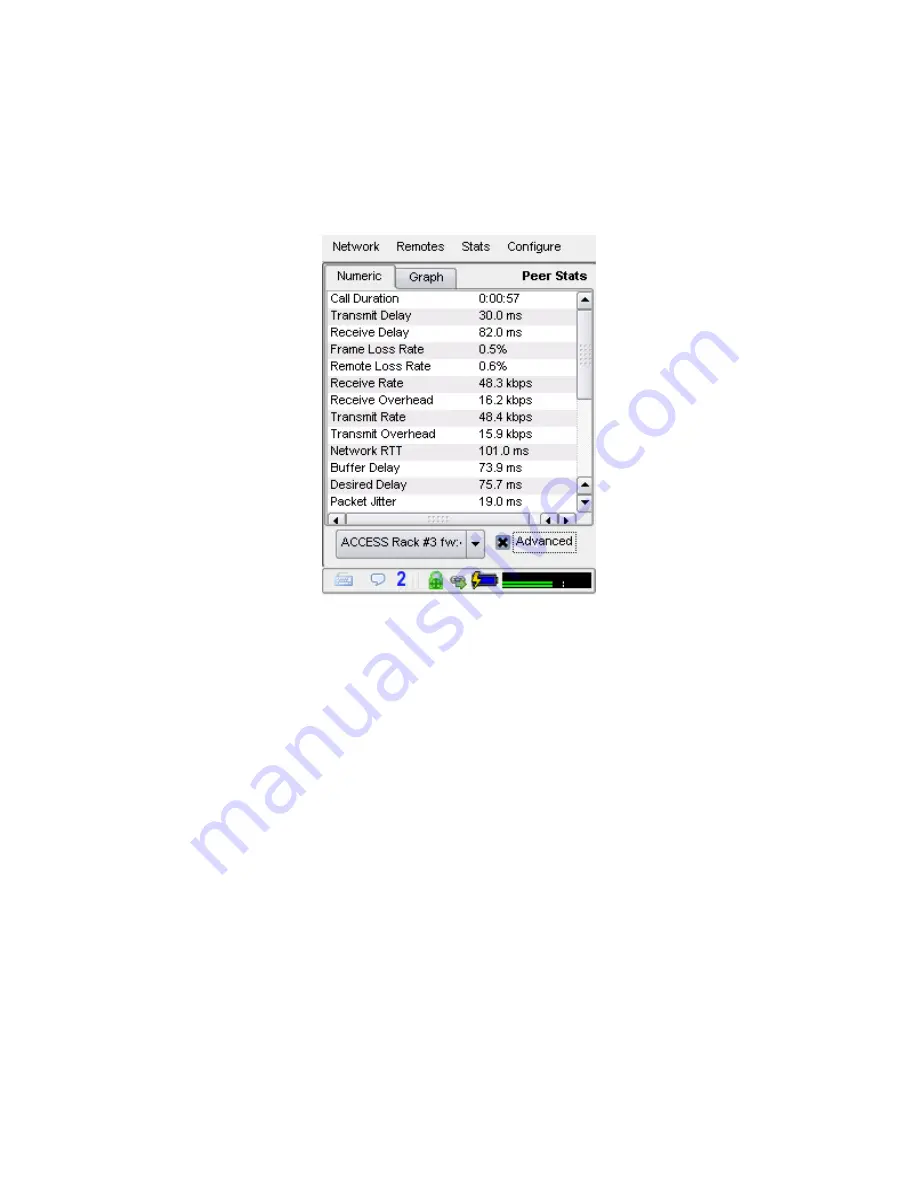
Here’s a brief description of the statistics available on the
Peer Status Numeric Tab
:
•
Call Duration
-The total elapsed time of the current call.
•
Transmit / Receive Delay
- These figures are an estimation of how much delay (in
milliseconds) is attributed to each end of the link. This includes coding delay and buffering,
but does not include any delay caused by the network.
•
Frame Loss Rate
- The percentage of packets considered to be lost and subject to error
concealment.
•
Remote Loss Rate
- The percentage packet loss reported by the decoder on the far end of the
connection. This statistic is only valid when using the “BRIC normal”
channel between two
ACCESS units with software revision 2.3 or higher. It’s updated at 5 second intervals.
•
Receive Rate
- The data rate at which frames are fed into the decoder, exclusive of protocol
headers.
•
Receive Overhead
- The rate of RTP, UDP and IP protocol headers being received and stripped
by the decoder.
•
Transmit Rate
- The data rate of frames being generated by the transmitter, exclusive of
protocol overhead.
•
Transmit Overhead
- The rate of RTP, UDP, and IP protocol headers being added to the
encoder frames.
Содержание ACCESS 2USB
Страница 1: ...Product Manual ...


